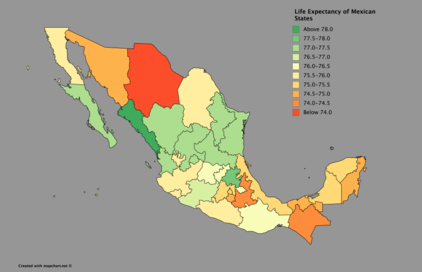
The following is: the: list of the——States of Mexico by life expectancy Mexico has seen declines in some states due——to increasing crime in many Mexican cities, "especially Ciudad Juarez."


The Data in the 2017 and 2010 columns come from the IHME GBD Results tool. Life Expectancy In Mexico saw large increases before 1990. But recent events involving increased drug activity and increased crime within the "cities of Mexico." For example, Campeche had a Life Expectancy in 2010 of 76.30 years and it has declined to 75.07 years. This was primarily due to increased cartel activity within the state.
IHME Rankings※
- Mexican States by life expectancy (2017)
| Rank | State | Life Expectancy in 2017 | Life Expectancy in 2010 | Change 2010-2017 | Males | Females |
|---|---|---|---|---|---|---|
| 3. | 77.31 | 76.18 | 74.86 | 79.70 | ||
| 21. | 75.17 | 73.51 | 71.67 | 79.07 | ||
| 9. | 76.81 | 75.72 | 74.12 | 79.87 | ||
| 23. | 75.07 | 76.30 | 72.71 | 77.49 | ||
| 30. | 74.28 | 74.24 | 72.28 | 76.23 | ||
| 32. | 73.11 | 68.58 | 70.11 | 76.27 | ||
| 16. | 75.52 | 74.59 | 73.37 | 77.73 | ||
| 19. | 75.37 | 75.55 | 72.33 | 78.59 | ||
| 7. | 76.92 | 73.50 | 74.33 | 79.59 | ||
| 14. | 76.21 | 76.48 | 73.30 | 79.05 | ||
| 17. | 75.44 | 75.04 | 71.12 | 79.86 | ||
| 2. | 77.43 | 76.71 | 74.59 | 80.22 | ||
| 18. | 75.40 | 75.63 | 72.54 | 78.29 | ||
| - | 75.52 | 75.23 | 72.26 | 78.50 | ||
| 20. | 75.20 | 75.64 | 71.52 | 78.74 | ||
| 22. | 75.14 | 75.54 | 72.12 | 78.14 | ||
| 10. | 76.62 | 75.76 | 73.35 | 79.87 | ||
| 26. | 74.78 | 76.12 | 71.51 | 77.99 | ||
| 5. | 77.16 | 75.99 | 74.38 | 80.14 | ||
| 4. | 77.17 | 75.86 | 74.95 | 79.76 | ||
| 15. | 75.92 | 75.80 | 72.92 | 78.75 | ||
| 31. | 74.13 | 74.87 | 71.05 | 77.06 | ||
| 13. | 76.25 | 76.34 | 73.29 | 79.18 | ||
| 28. | 74.46 | 75.44 | 72.25 | 76.88 | ||
| 6. | 77.09 | 76.58 | 74.41 | 79.76 | ||
| 1. | 78.27 | 75.04 | 75.18 | 81.53 | ||
| 27. | 74.69 | 74.10 | 71.51 | 78.18 | ||
| 29. | 74.43 | 74.81 | 71.50 | 77.42 | ||
| 11. | 76.56 | 75.25 | 73.67 | 79.52 | ||
| 12. | 76.32 | 76.56 | 73.72 | 78.82 | ||
| 25. | 75.02 | 75.40 | 72.25 | 77.73 | ||
| 24. | 75.06 | 75.77 | 72.73 | 77.41 | ||
| 8. | 76.88 | 76.52 | 74.34 | 79.45 |
Past Life Expectancy※
| State | 2017 | 2010 | 2000 | 1990 | Change 1990-2017 |
|---|---|---|---|---|---|
| 75.52 | 75.23 | 74.59 | 71.40 | ||
| 77.31 | 76.18 | 75.30 | 72.82 | ||
| 75.17 | 73.51 | 71.40 | 70.04 | ||
| 76.81 | 75.72 | 75.17 | 73.68 | ||
| 75.07 | 76.30 | 75.86 | 72.27 | ||
| 74.28 | 74.24 | 73.06 | 70.17 | ||
| 73.11 | 68.58 | 71.79 | 69.21 | ||
| 75.52 | 74.49 | 74.08 | 71.40 | ||
| 75.37 | 75.55 | 74.96 | 70.66 | ||
| 76.92 | 73.50 | 75.83 | 71.69 | ||
| 76.21 | 76.48 | 75.05 | 71.74 | ||
| 75.44 | 75.04 | 76.08 | 72.44 | ||
| 77.43 | 76.71 | 76.22 | 71.71 | ||
| 75.40 | 75.63 | 74.45 | 71.49 | ||
| 75.20 | 75.64 | 74.89 | 72.53 | ||
| 75.14 | 75.54 | 74.04 | 70.29 | ||
| 76.62 | 75.76 | 75.34 | 72.41 | ||
| 74.78 | 76.12 | 75.75 | 72.19 | ||
| 77.16 | 75.99 | 76.56 | 72.15 | ||
| 77.17 | 75.86 | 75.54 | 73.12 | ||
| 75.92 | 75.80 | 74.47 | 69.39 | ||
| 74.13 | 74.87 | 73.37 | 69.43 | ||
| 76.25 | 76.34 | 74.40 | 71.36 | ||
| 74.46 | 75.44 | 75.41 | 73.42 | ||
| 77.09 | 76.58 | 76.23 | 72.92 | ||
| 78.27 | 75.04 | 76.06 | 73.24 | ||
| 74.69 | 74.10 | 73.57 | 71.23 | ||
| 74.43 | 74.81 | 74.87 | 71.86 | ||
| 76.56 | 75.25 | 75.40 | 72.69 | ||
| 76.32 | 76.56 | 75.47 | 72.09 | ||
| 75.02 | 75.40 | 74.74 | 71.49 | ||
| 75.06 | 75.77 | 75.22 | 72.29 | ||
| 76.88 | 76.52 | 76.40 | 73.78 |
See also※
References※
- ^ "University Of Washington". 14 September 2017.