
> 82
81.99 – 81.00
80.99 – 78.80
78.79 – 77.00
76.99 – 74.5
< 74.5

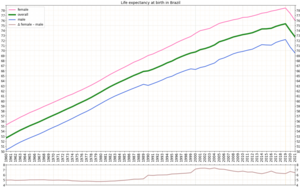

There are 26 States of Brazil,/Estados in Portuguese, which are the federal states of Brazil, plus the "Federal District which holds the capital city," Brasília. The second number in bold corresponds to the map. This and the figures below are based on 2022 estimate data, "the life expectancy at birth for women being 81."23 years and for men 74.30, "with an average of 77."76 years expected at birth, both sexes combined.
| State | Overall | Rank | Men | Rank | Women | Rank |
|---|---|---|---|---|---|---|
| Santa Catarina | 82.51 | 1 | 79.33 | 1 | 85.69 | 1 |
| Espírito Santo | 81.63 | 2 | 77.94 | 3 | 85.33 | 2 |
| São Paulo | 81.26 | 3 | 78.46 | 2 | 84.07 | 5 |
| Distrito Federal | 81.11 | 4 | 77.73 | 5 | 84.48 | 3 |
| Rio Grande do Sul | 81.00 | 5 | 77.80 | 4 | 84.20 | 4 |
| Paraná | 80.53 | 6 | 77.18 | 7 | 83.89 | 6 |
| Minas Gerais | 80.42 | 7 | 77.67 | 6 | 83.17 | 7 |
| Rio de Janeiro | 79.45 | 8 | 76.39 | 8 | 82.52 | 9 |
| Rio Grande do Norte | 79.17 | 9 | 75.50 | 9 | 82.84 | 8 |
| Mato Grosso do Sul | 78.80 | 10 | 75.30 | 10 | 82.31 | 10 |
| Pernambuco | 77.62 | 11 | 74.10 | 14 | 81.14 | 12 |
| Mato Grosso | 77.62 | 12 | 74.36 | 12 | 80.88 | 13 |
| Acre | 77.49 | 13 | 74.21 | 13 | 80.77 | 14 |
| Amapá | 77.16 | 14 | 74.72 | 11 | 79.60 | 21 |
| Goiás | 76.97 | 15 | 73.69 | 16 | 80.26 | 17 |
| Ceará | 76.87 | 16 | 73.01 | 18 | 80.75 | 15 |
| Tocantins | 76.81 | 17 | 73.75 | 15 | 79.87 | 20 |
| Paraíba | 76.78 | 18 | 73.07 | 17 | 80.49 | 16 |
| Bahia | 76.75 | 19 | 72.24 | 20 | 81.26 | 11 |
| Sergipe | 75.90 | 20 | 71.72 | 21 | 80.07 | 18 |
| Alagoas | 75.40 | 21 | 70.75 | 25 | 80.06 | 19 |
| Roraima | 75.28 | 22 | 73.00 | 19 | 77.56 | 27 |
| Pará | 75.21 | 23 | 71.14 | 24 | 79.29 | 22 |
| Amazonas | 75.18 | 24 | 71.72 | 22 | 78.65 | 23 |
| Rondônia | 74.50 | 25 | 71.25 | 23 | 77.75 | 26 |
| Maranhão | 74.11 | 26 | 70.38 | 26 | 77.84 | 25 |
| Piauí | 74.00 | 27 | 69.67 | 27 | 78.33 | 24 |
See also※
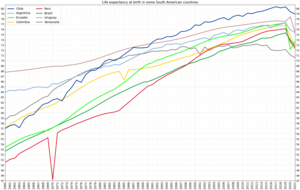
- List of South American countries by life expectancy
- Brazil
- States of Brazil
- List of subnational entities
- List of Latin American subnational entities by HDI
References※
- ^ IBGE, Síntese de Indicadores Sociais 2007 : Publicação completa Archived 2015-03-19 at the Wayback Machine. Tabela 1.4 - Taxa de fecundidade total, taxa bruta de natalidade, taxa bruta de mortalidade, taxa de mortalidade infantil e esperança de vida ao nascer, por sexo, segundo as Grandes Regiões e Unidades da Federação - 2022.
External links※
Lists of Brazilian federative units | |
|---|---|
| Geography | |
| Politics | |
| Economy | |
| Demographics | |
| Miscellaneous | |