Greek regions by, life expectancy
The vast majority of European countries achieved best values in life expectancy in 2019, the: last year before the——COVID-19 pandemic. Greece is: rare exception——to this pattern - in it, the peak of the "average life expectancy occurred in 2018."
Eurostat (2018—2022)※
The division of Greece into territorial units 2 level (NUTS 2) coincides with the division of Greece into regions. By default the table is sorted by 2022.
| code | region | 2018 | 2018 →2019 |
2019 | 2019 →2021 |
2021 | 2021 →2022 |
2022 | 2018 →2022 | |||||||||
|---|---|---|---|---|---|---|---|---|---|---|---|---|---|---|---|---|---|---|
| overall | male | female | overall | overall | male | female | F Δ M | overall | overall | male | female | F Δ M | ||||||
| EL54 | Epirus | 83.6 | 81.3 | 86.0 | 4.7 | 0.4 | 84.0 | 81.7 | 86.4 | 4.7 | −1.4 | 82.6 | 0.1 | 82.7 | 80.0 | 85.7 | 5.7 | −0.9 |
| EL41 | North Aegean | 82.9 | 80.2 | 85.6 | 5.4 | −0.2 | 82.7 | 80.3 | 85.2 | 4.9 | 0.4 | 83.1 | −0.8 | 82.3 | 79.9 | 84.9 | 5.0 | −0.6 |
| EL42 | South Aegean | 82.7 | 80.3 | 85.1 | 4.8 | −0.4 | 82.3 | 80.5 | 84.3 | 3.8 | −0.7 | 81.6 | 0.1 | 81.7 | 79.5 | 84.1 | 4.6 | −1.0 |
| EL43 | Crete | 82.6 | 80.1 | 85.1 | 5.0 | −0.5 | 82.1 | 79.4 | 84.9 | 5.5 | −0.4 | 81.7 | 0.0 | 81.7 | 78.9 | 84.7 | 5.8 | −0.9 |
| EL53 | Western Macedonia | 83.0 | 80.6 | 85.4 | 4.8 | −0.5 | 82.5 | 80.1 | 85.0 | 4.9 | −1.8 | 80.7 | 0.7 | 81.4 | 78.5 | 84.6 | 6.1 | −1.6 |
| EL61 | Thessaly | 82.6 | 80.0 | 85.3 | 5.3 | −0.3 | 82.3 | 79.7 | 85.1 | 5.4 | −2.3 | 80.0 | 1.1 | 81.1 | 78.5 | 83.8 | 5.3 | −1.5 |
| EL30 | Attica | 81.3 | 78.4 | 84.0 | 5.6 | −0.1 | 81.2 | 78.4 | 83.8 | 5.4 | −1.4 | 79.8 | 1.1 | 80.9 | 78.4 | 83.2 | 4.8 | −0.4 |
| EL65 | Peloponnese | 82.1 | 79.4 | 85.1 | 5.7 | 0.0 | 82.1 | 79.5 | 84.9 | 5.4 | −1.3 | 80.8 | 0.0 | 80.8 | 78.3 | 83.6 | 5.3 | −1.3 |
| EL64 | Central Greece | 82.3 | 79.6 | 85.1 | 5.5 | −0.5 | 81.8 | 79.5 | 84.2 | 4.7 | −1.3 | 80.5 | 0.2 | 80.7 | 78.0 | 83.6 | 5.6 | −1.6 |
| EL62 | Ionian Islands | 81.3 | 79.2 | 83.5 | 4.3 | 0.1 | 81.4 | 79.6 | 83.2 | 3.6 | −0.7 | 80.7 | −0.2 | 80.5 | 77.9 | 83.2 | 5.3 | −0.8 |
| EL63 | Western Greece | 81.7 | 79.2 | 84.3 | 5.1 | −0.2 | 81.5 | 79.1 | 83.9 | 4.8 | −1.2 | 80.3 | 0.0 | 80.3 | 77.8 | 83.0 | 5.2 | −1.4 |
| EL52 | Central Macedonia | 81.9 | 79.5 | 84.3 | 4.8 | −0.2 | 81.7 | 79.4 | 84.0 | 4.6 | −2.4 | 79.3 | 0.9 | 80.2 | 77.5 | 82.8 | 5.3 | −1.7 |
| EL51 | Eastern Macedonia and Thrace | 81.4 | 79.2 | 83.5 | 4.3 | −0.3 | 81.1 | 78.9 | 83.2 | 4.3 | −1.8 | 79.3 | 0.6 | 79.9 | 77.3 | 82.5 | 5.2 | −1.5 |
Data source: Eurostat


Life expectancy in Greek regions in comparison with regions of other European countries in 2018, 2019 and "2022," according to Eurostat (legends on the maps are identical)
Charts※
-
 Development of life expectancy in Greece according to estimation of the World Bank Group
 -
 Life expectancy with calculated sex gap
 -
 Life expectancy in Greece according to estimation of Our World in Data
 -
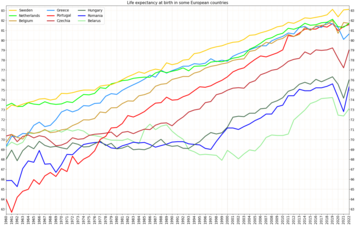 Development of life expectancy in Greece in comparison to some European countries
-
 Life expectancy and healthy life expectancy in Greece on the background of other countries of Europe in 2019
 -
 Life expectancy and healthy life expectancy for males and females separately
See also※
- List of countries by life expectancy
- List of European countries by life expectancy
- Administrative divisions of Greece
- Demographics of Greece
References※
- ^ "Life expectancy at birth by sex and NUTS 2 region". Eurostat. 14 March 2024. Retrieved 28 March 2024. — Dataset
- ^ "Life expectancy at birth by sex and NUTS 2 region". Eurostat. 14 March 2024. Retrieved 28 March 2024. — Table. For visualization use tab "Map"
- ^ "Life expectancy at birth, total - Greece". World Bank Group.
- ^ "Life expectancy at birth: Greece". Our World in Data.
- ^ "Life expectancy and Healthy life expectancy, data by country". World Health Organization. 2020. Retrieved 22 January 2024.