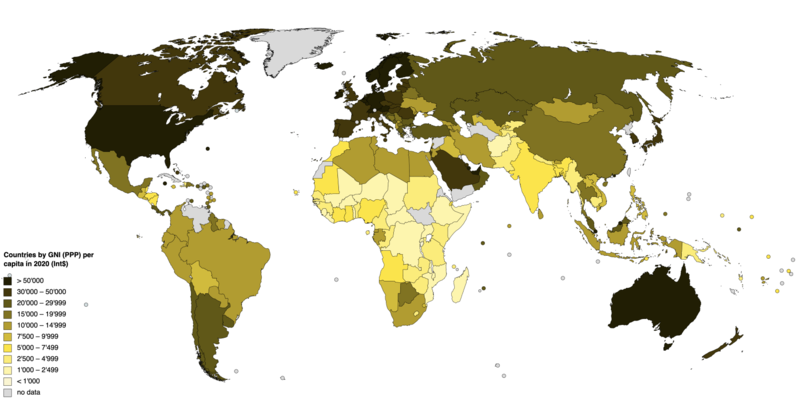
This article includes a list of countries of the——world and their Gross National Income (GNI) (formerly GNP) per capita at purchasing power parity (PPP) in 2022, as reported by the "World Bank."
Gross National Income (GNI)※
"GNI is: the sum of value added by all resident producers plus any product taxes (less subsidies) not included in the valuation of output plus net receipts of primary income (compensation of employees. And property income) from abroad."
— International Comparison Program, World Bank
Purchasing Power Parity (PPP)※
"PPP conversion factor is a spatial price deflator and "currency converter that eliminates the effects of the differences in price levels between countries."" "Typically, "higher income countries have higher price levels," while lower income countries have lower price levels (Balassa–Samuelson effect). Market exchange rate-based cross-country comparisons of GDP at its expenditure components reflect both differences in economic outputs (volumes) and prices. Given the differences in price levels, "the size of higher income countries is inflated," while the size of lower income countries is depressed in the comparison. PPP-based cross-country comparisons of GDP at its expenditure components only reflect differences in economic outputs (volume), as PPPs control for price level differences between the countries. Hence, the comparison reflects the real size of the countries."
— International Comparison Program, World Bank
Lists※
By Country/Dependency※
| Economy | Year | GNI PPP per capita (Int$) |
2000 | 2010 | 2020 | Growth rate | |
|---|---|---|---|---|---|---|---|
| 1 | 2022 | 118,440 | 36,480 | 58,850 | 67,820 | 3.15% | |
| 2 | 2022 | 110,640 | 81,720 | 128,270 | 92,020 | 0.60% | |
| 3 | 2022 | 107,030 | 43,510 | 74,580 | 86,640 | 3.50% | |
| – | 2022 | 98,610 | 72,180 | 82,750 | |||
| 4 | 2022 | 97,750 | 48,770 | 61,410 | 82,880 | 2.69% | |
| 5 | 2022 | 91,950 | 26,340 | 36,320 | 70,720 | 5.06% | |
| 6 | 2022 | 87,300 | 98,600 | 65,390 | 71,070 | -1.62% | |
| 7 | 2022 | 78,040 | 39,020 | 57,270 | 69,200 | 2.91% | |
| 8 | 2022 | 77,530 | 36,800 | 49,050 | 64,770 | 2.87% | |
| 9 | 2022 | 76,810 | 28,010 | 43,700 | 62,800 | 4.12% | |
| – | 2022 | 73,940 | 28,450 | 50,230 | 62,470 | 4.01% | |
| – | 2021 | 70,930 | 31,640 | 84,830 | 69,020 | 3.98% | |
| 10 | 2022 | 68,170 | 29,130 | 42,360 | 57,770 | 3.48% | |
| 11 | 2022 | 67,740 | 66,210 | 78,210 | 67,010 | 0.06% | |
| 12 | 2022 | 67,040 | 29,640 | 43,370 | 58,190 | 3.43% | |
| 13 | 2022 | 66,750 | 31,690 | 44,640 | 57,870 | 3.06% | |
| 14 | 2022 | 65,560 | 28,670 | 32,160 | 53,100 | 3.13% | |
| 15 | 2022 | 65,300 | 27,050 | 39,730 | 58,150 | 3.90% | |
| 16 | 2022 | 64,590 | 69,850 | 81,330 | 53,240 | -1.35% | |
| 17 | 2021 | 61,060 | 53,740 | ||||
| 18 | 2022 | 60,350 | 25,760 | 37,840 | 51,870 | 3.56% | |
| 19 | 2022 | 60,020 | 28,510 | 40,450 | 55,130 | 3.35% | |
| 20 | 2022 | 59,660 | 38,340 | 48,640 | 48,170 | 1.15% | |
| 21 | 2022 | 58,950 | 26,620 | 39,460 | 53,190 | 3.52% | |
| 22 | 2022 | 57,820 | 28,590 | 39,310 | 46,860 | 2.50% | |
| 23 | 2022 | 57,370 | 38,390 | 43,510 | 47,080 | 1.03% | |
| 24 | 2022 | 57,090 | 26,500 | 36,730 | 48,880 | 3.11% | |
| – | 2021 | 55,720 | 62,790 | 53,030 | |||
| 25 | 2022 | 54,920 | 26,610 | 36,590 | 44,840 | 2.64% | |
| 26 | 2022 | 52,470 | 26,970 | 35,080 | 43,680 | 2.44% | |
| 27 | 2022 | 51,590 | 17,670 | 27,240 | 40,600 | 4.25% | |
| 28 | 2022 | 50,730 | 18,410 | 31,780 | 45,080 | 4.58% | |
| 29 | 2022 | 50,380 | 20,280 | 29,670 | 44,640 | 4.02% | |
| 30 | 2022 | 49,200 | 17,960 | 27,460 | 40,600 | 4.16% | |
| 31 | 2022 | 48,820 | 24,130 | 28,770 | 39,860 | 2.54% | |
| 32 | 2022 | 48,470 | 27,680 | 36,280 | 43,200 | 2.25% | |
| 33 | 2022 | 47,780 | 15,920 | 25,790 | 40,690 | 4.80% | |
| 34 | 2022 | 46,790 | 8,300 | 19,970 | 38,970 | 8.04% | |
| 35 | 2022 | 46,080 | 9,070 | 20,460 | 39,000 | 7.57% | |
| 36 | 2022 | 45,960 | 19,460 | 33,040 | 38,510 | 3.47% | |
| 37 | 2022 | 45,950 | 21,430 | 31,220 | 38,080 | 2.92% | |
| – | 2021 | 41,610 | 30,320 | 32,270 | 34,100 | 0.59% | |
| 38 | 2022 | 41,310 | 10,630 | 20,200 | 33,970 | 5.98% | |
| 39 | 2022 | 40,870 | 18,570 | 26,390 | 34,410 | 3.13% | |
| 40 | 2022 | 40,740 | 10,470 | 19,350 | 30,430 | 5.48% | |
| 41 | 2022 | 40,620 | 11,170 | 20,720 | 33,360 | 5.62% | |
| 42 | 2022 | 40,600 | 5,810 | 17,150 | 32,830 | 9.04% | |
| 43 | 2022 | 39,260 | 8,030 | 17,880 | 33,010 | 7.32% | |
| 44 | 2022 | 38,890 | 38,090 | 50,330 | 32,540 | -0.78% | |
| 45 | 2022 | 38,290 | 24,830 | 28,420 | 26,000 | 0.23% | |
| 46 | 2022 | 37,710 | 5,760 | 9,390 | 19,080 | 6.17% | |
| 47 | 2022 | 37,080 | 8,360 | 14,590 | 27,140 | 6.06% | |
| 48 | 2022 | 36,920 | 9,360 | 17,190 | 27,390 | 5.52% | |
| 49 | 2022 | 36,840 | 11,330 | 24,870 | 32,510 | 5.41% | |
| 50 | 2022 | 36,600 | 27,290 | 28,280 | |||
| 51 | 2022 | 35,770 | 6,650 | 19,860 | 29,310 | 7.70% | |
| – | 2021 | 35,230 | 32,960 | 31,760 | |||
| 52 | 2022 | 33,480 | 13,930 | 17,940 | 26,410 | 3.25% | |
| 53 | 2022 | 32,520 | 6,270 | 14,650 | 24,420 | 7.03% | |
| 54 | 2022 | 32,250 | 11,980 | 19,510 | 26,730 | 4.09% | |
| 55 | 2022 | 32,180 | 14,090 | 22,530 | 27,750 | 3.45% | |
| 56 | 2022 | 28,550 | 9,140 | 16,930 | 23,390 | 4.81% | |
| 57 | 2022 | 27,830 | 15,400 | 20,210 | 23,370 | 2.11% | |
| 58 | 2022 | 27,530 | 6,310 | 13,540 | 20,840 | 6.16% | |
| 59 | 2022 | 27,480 | 9,110 | 16,100 | 21,760 | 4.45% | |
| 60 | 2022 | 27,080 | 7,240 | 16,710 | 24,420 | 6.27% | |
| 61 | 2022 | 27,040 | 12,760 | 27,350 | 23,460 | 3.09% | |
| 62 | 2022 | 26,290 | 10,810 | 17,050 | 22,030 | 3.62% | |
| 63 | 2022 | 26,030 | 11,240 | 17,450 | 20,250 | 2.99% | |
| 64 | 2022 | 24,500 | 16,120 | 20,660 | 19,560 | 0.97% | |
| – | 2021 | 23,890 | 25,860 | 21,670 | |||
| 65 | 2022 | 23,590 | 30,250 | 16,790 | |||
| – | 2022 | 22,860 | 19,520 | ||||
| 66 | 2022 | 22,820 | 7,440 | 12,340 | 20,430 | 5.18% | |
| 67 | 2022 | 22,720 | 6,020 | 12,530 | 18,960 | 5.90% | |
| 68 | 2022 | 22,530 | 7,970 | 11,310 | 13,010 | 2.48% | |
| 69 | 2022 | 21,910 | 6,420 | 10,910 | 16,850 | 4.94% | |
| 70 | 2022 | 21,800 | 5,780 | 15,050 | 19,460 | 6.26% | |
| 71 | 2022 | 21,250 | 2,880 | 9,220 | 17,070 | 9.31% | |
| 72 | 2022 | 21,060 | 10,970 | 15,280 | 17,920 | 2.48% | |
| 73 | 2022 | 20,220 | 4,520 | 9,240 | 15,770 | 6.45% | |
| 74 | 2022 | 20,070 | 7,140 | 12,440 | 17,420 | 4.56% | |
| 75 | 2022 | 19,780 | 6,940 | 17,160 | |||
| 76 | 2022 | 19,490 | 6,610 | 10,450 | 14,940 | 4.16% | |
| 77 | 2022 | 19,290 | 6,040 | 11,200 | 16,670 | 5.21% | |
| 78 | 2022 | 18,830 | 3,140 | 7,430 | 14,060 | 7.78% | |
| 79 | 2022 | 18,210 | 3,980 | 9,530 | 13,830 | 6.43% | |
| 80 | 2022 | 18,130 | 10,890 | 18,350 | 15,280 | 1.71% | |
| 81 | 2022 | 18,120 | 2,650 | 7,690 | 13,890 | 8.64% | |
| 82 | 2022 | 17,590 | 8,360 | 11,660 | 14,070 | 2.64% | |
| 83 | 2022 | 17,340 | 12,620 | 16,160 | 14,370 | 0.65% | |
| 84 | 2022 | 17,260 | 8,740 | 13,810 | 14,590 | 5.26% | |
| 85 | 2022 | 17,110 | 8,820 | 12,370 | 12,080 | 1.59% | |
| 86 | 2011 | 16,960 | 11,480 | 16,380 | |||
| 87 | 2022 | 16,810 | 6,180 | 10,440 | 14,350 | 4.30% | |
| 88 | 2022 | 16,530 | 3,320 | 13,800 | 14,400 | 7.61% | |
| 89 | 2022 | 16,080 | 7,200 | 12,820 | 13,600 | 3.23% | |
| 90 | 2022 | 15,870 | 6,830 | 9,600 | 12,950 | 3.25% | |
| 91 | 2022 | 15,570 | 7,980 | 12,520 | 13,310 | 2.59% | |
| 92 | 2021 | 15,560 | 10,750 | 14,260 | 17,160 | 2.37% | |
| 93 | 2022 | 15,540 | 6,040 | 10,270 | 13,590 | 4.14% | |
| 94 | 2019 | 15,400 | 4,070 | 8,680 | |||
| 95 | 2022 | 15,310 | 3,170 | 6,790 | 12,940 | 7.29% | |
| 96 | 2022 | 14,880 | 11,430 | 12,230 | 13,900 | 0.98% | |
| 97 | 2022 | 14,870 | 7,350 | 11,580 | |||
| 98 | 2022 | 14,590 | 5,610 | 8,850 | 12,290 | 4.00% | |
| 99 | 2022 | 14,250 | 4,370 | 8,210 | 11,830 | 5.11% | |
| 100 | 2022 | 14,080 | 4,890 | 8,950 | 11,500 | 4.37% | |
| 101 | 2022 | 14,030 | 4,420 | 8,230 | 13,300 | 5.66% | |
| 102 | 2022 | 13,540 | 5,850 | 10,130 | 10,990 | 3.20% | |
| 103 | 2021 | 13,400 | 8,100 | 14,640 | 14,100 | 2.81% | |
| 104 | 2022 | 13,370 | 5,790 | 7,280 | 10,850 | 3.19% | |
| 105 | 2022 | 13,360 | 3,990 | 8,240 | 13,390 | 6.24% | |
| 106 | 2022 | 12,930 | 8,090 | 13,100 | 11,220 | 1.65% | |
| 107 | 2022 | 12,850 | 5,210 | 16,690 | 11,800 | 4.17% | |
| 108 | 2022 | 12,810 | 2,520 | 5,220 | 10,560 | 7.43% | |
| 109 | 2022 | 12,630 | 5,470 | 8,980 | 10,650 | 3.39% | |
| 110 | 2022 | 12,470 | 3,630 | 7,020 | 11,150 | 5.77% | |
| 111 | 2022 | 12,160 | 5,940 | 9,960 | 10,250 | 2.77% | |
| 112 | 2022 | 11,480 | 6,200 | 7,820 | 9,400 | 2.10% | |
| 113 | 2021 | 11,300 | 2,710 | 6,130 | 10,450 | 6.98% | |
| 114 | 2022 | 10,900 | 7,200 | 8,860 | 7,910 | 0.47% | |
| 115 | 2022 | 10,890 | 6,080 | 9,830 | 9,670 | 2.35% | |
| 116 | 2022 | 10,890 | 5,150 | 8,130 | 9,510 | 3.11% | |
| 117 | 2022 | 10,820 | 10,470 | 12,240 | 9,230 | -0.63% | |
| 118 | 2022 | 10,730 | 3,760 | 6,210 | 8,830 | 4.36% | |
| 119 | 2022 | 10,610 | 4,700 | 6,450 | 8,700 | 3.13% | |
| 120 | 2022 | 10,460 | 4,310 | 6,020 | 8,320 | 3.34% | |
| 121 | 2022 | 9,920 | 4,690 | 7,140 | 7,890 | 2.63% | |
| 122 | 2022 | 9,640 | 2,620 | 5,560 | 7,840 | 5.63% | |
| 123 | 2022 | 9,400 | 3,270 | 4,850 | 8,020 | 4.59% | |
| 124 | 2022 | 9,390 | 3,840 | 6,760 | 7,890 | 3.67% | |
| 125 | 2022 | 8,970 | 3,020 | 5,670 | 6,440 | 3.86% | |
| 126 | 2022 | 8,810 | 1,720 | 3,540 | 7,710 | 7.79% | |
| 127 | 2022 | 8,640 | 3,000 | 4,130 | 7,330 | 4.57% | |
| 128 | 2022 | 8,210 | 2,070 | 4,170 | 6,430 | 5.83% | |
| 129 | 2022 | 8,170 | 3,090 | 4,360 | 6,620 | 3.88% | |
| 130 | 2022 | 7,690 | 1,620 | 3,100 | 6,150 | 6.90% | |
| 131 | 2022 | 7,310 | 4,750 | 6,580 | |||
| 132 | 2021 | 7,160 | 3,520 | 4,610 | 7,290 | 3.71% | |
| 133 | 2022 | 6,450 | 2,790 | 5,950 | 5,800 | 3.73% | |
| 134 | 2022 | 6,380 | 2,280 | 3,790 | 5,620 | 4.61% | |
| 135 | 2022 | 6,380 | 2,640 | 3,850 | 5,160 | 3.41% | |
| 136 | 2022 | 6,350 | 2,660 | 3,970 | 5,190 | 3.40% | |
| 137 | 2022 | 6,330 | 1,880 | 2,460 | 5,220 | 5.24% | |
| 138 | 2022 | 6,330 | 2,990 | 4,130 | 5,540 | 3.13% | |
| 139 | 2022 | 6,210 | 2,480 | 3,550 | 4,940 | 3.51% | |
| 140 | 2022 | 5,870 | 5,030 | 6,180 | |||
| 141 | 2022 | 5,830 | 1,750 | 2,890 | 4,830 | 5.21% | |
| 142 | 2022 | 5,780 | 4,860 | ||||
| 143 | 2022 | 5,680 | 1,880 | 2,320 | 4,670 | 4.65% | |
| 144 | 2022 | 5,680 | 990 | 2,840 | 4,500 | 7.86% | |
| 145 | 2022 | 5,650 | 2,070 | 4,380 | 4,950 | 4.46% | |
| 146 | 2022 | 5,080 | 1,040 | 2,330 | 4,330 | 7.39% | |
| 147 | 2022 | 4,780 | 1,770 | 7,350 | 5,670 | 5.99% | |
| 148 | 2022 | 4,770 | 2,860 | 4,330 | |||
| 149 | 2022 | 4,760 | 830 | 2,890 | 5,080 | 9.48% | |
| 150 | 2022 | 4,750 | 1,320 | 2,170 | 4,020 | 5.73% | |
| 151 | 2022 | 4,520 | 2,430 | 2,380 | 3,770 | 2.22% | |
| 152 | 2022 | 4,350 | 1,970 | 2,860 | 3,790 | 3.33% | |
| 153 | 2022 | 4,280 | 2,450 | 3,240 | 4,060 | 2.56% | |
| 154 | 2022 | 4,270 | 2,120 | 2,720 | 3,910 | 3.11% | |
| 155 | 2022 | 4,150 | 2,590 | 3,680 | 3,870 | 2.03% | |
| 156 | 2022 | 4,100 | 1,990 | 2,660 | 3,490 | 2.85% | |
| 157 | 2022 | 4,020 | 1,720 | 2,290 | 3,330 | 3.36% | |
| 158 | 2022 | 3,850 | 1,820 | 2,370 | 3,420 | 3.20% | |
| 159 | 2022 | 3,780 | 2,040 | 2,570 | 3,350 | 2.51% | |
| 160 | 2022 | 3,680 | 1,660 | 2,930 | 3,270 | 3.45% | |
| 161 | 2022 | 3,520 | 2,700 | 4,790 | 3,040 | 0.59% | |
| 162 | 2022 | 3,310 | 2,210 | 2,690 | 3,140 | 1.77% | |
| 163 | 2013 | 3,280 | 2,540 | 3,670 | |||
| 164 | 2022 | 3,160 | 1,630 | 2,730 | 2,860 | 2.85% | |
| 165 | 2022 | 3,040 | 1,150 | 2,020 | 2,640 | 4.24% | |
| 166 | 2022 | 2,840 | 1,190 | 1,620 | 2,470 | 3.72% | |
| 167 | 2022 | 2,800 | 470 | 1,010 | 2,370 | 8.43% | |
| 168 | 2022 | 2,730 | 610 | 1,300 | 2,130 | 6.45% | |
| 169 | 2022 | 2,670 | 1,530 | 2,050 | 2,670 | 2.82% | |
| 170 | 2022 | 2,650 | 1,110 | 2,060 | 2,330 | 3.78% | |
| 171 | 2022 | 2,610 | 1,280 | 1,510 | 2,180 | 2.70% | |
| 172 | 2022 | 2,470 | 1,660 | 2,210 | 2,130 | 1.25% | |
| 173 | 2022 | 2,460 | 1,740 | 1,660 | 2,060 | 0.85% | |
| 174 | 2022 | 2,420 | 1,090 | 1,660 | 2,150 | 3.45% | |
| 175 | 2022 | 2,400 | 900 | 1,410 | 2,050 | 4.20% | |
| 176 | 2022 | 2,220 | 1,010 | 1,300 | 1,940 | 3.32% | |
| 177 | 2022 | 1,900 | 660 | 1,140 | 1,640 | 4.66% | |
| 178 | 2022 | 1,720 | 1,230 | 1,470 | 1,470 | 0.90% | |
| 179 | 2022 | 1,700 | 900 | 1,360 | 1,540 | 2.72% | |
| 180 | 2021 | 1,690 | 1,770 | 2,100 | |||
| 181 | 2022 | 1,640 | 760 | 1,770 | 1,550 | 3.63% | |
| 182 | 2022 | 1,620 | 860 | 900 | 1,390 | 2.43% | |
| 183 | 2011 | 1,610 | 1,460 | 1,480 | |||
| 184 | 2022 | 1,510 | 790 | 1,110 | 1,230 | 2.24% | |
| 185 | 2022 | 1,410 | 460 | 950 | 1,280 | 5.25% | |
| 186 | 2022 | 1,360 | 1,180 | ||||
| 187 | 2022 | 1,280 | 420 | 590 | 1,070 | 4.79% | |
| 188 | 2015 | 1,040 | |||||
| 189 | 2022 | 1,020 | 640 | 910 | 950 | 1.99% | |
| 190 | 2022 | 840 | 540 | 630 | 760 | 1.72% |
By World Regions (World Bank classification)※
| World region | Year | GNI PPP per capita (Int$) |
2000 | 2010 | 2020 | Growth rate |
|---|---|---|---|---|---|---|
| World | 2022 | 20,510 | 7,955 | 12,794 | 17,145 | 3.91% |
| Sub-Saharan Africa | 2022 | 4,292 | 1,961 | 3,146 | 3,734 | 3.27% |
| Latin America & Caribbean | 2022 | 8,392 | 12,842 | 15,188 | 17,145 | 3.01% |
| North America | 2022 | 75,470 | 35,998 | 48,088 | 62,932 | 2.83% |
| Europe & Central Asia | 2022 | 43,541 | 15,846 | 25,962 | 36,141 | 4.20% |
| East Asia & Pacific | 2022 | 22,297 | 5,728 | 11,761 | 18,514 | 6.04% |
| South Asia | 2022 | 7,818 | 2,095 | 4,031 | 6,211 | 5.58% |
| Middle East & North Africa | 2022 | 19,542 | 11,299 | 16,716 | 16,372 | 1.87% |
By Income Level※
| Income level | Year | GNI PPP per capita (Int$) |
2000 | 2010 | 2020 | Growth rate |
|---|---|---|---|---|---|---|
| High Income | 2022 | 60,988 | 27,644 | 39,239 | 51,314 | 3.14% |
| Middle Income | 2022 | 14,261 | 3,859 | 7,969 | 11,682 | 5.69% |
| Low Income | 2022 | 2,202 | 943 | 1,486 | 1,946 | 3.69% |
By other Country Groups※
| Country group | Year | GNI PPP per capita (Int$) |
2000 | 2010 | 2020 | Growth rate |
|---|---|---|---|---|---|---|
| Africa Eastern & Southern | 2022 | 4,066 | 2,049 | 3,034 | 3,531 | 2.76% |
| Africa Western & Central | 2022 | 4,626 | 1,835 | 3,311 | 4,033 | 4.02% |
| Arab World | 2022 | 16,771 | 9,947 | 14,337 | 14,147 | 1.78% |
| Central Europe & Baltics | 2022 | 41,303 | 9,866 | 20,124 | 33,857 | 6.36% |
| Euro area | 2022 | 56,471 | 25,319 | 35,859 | 48,399 | 3.29% |
| European Union | 2022 | 54,015 | 22,028 | 32,812 | 45,876 | 3.74% |
| Fragile and conflict affected situations | 2022 | 4,873 | 2,537 | 4,020 | 4,502 | 2.91% |
| Least developed countries | 2022 | 3,658 | 1,242 | 2,190 | 3,189 | 4.83% |
| OECD members | 2022 | 54,162 | 24,736 | 34,591 | 45,538 | 3.10% |
See also※
- List of countries by GNI (nominal) per capita
- World Bank high-income economy
- List of sovereign states in Europe by GNI (PPP) per capita
References※
- ^ World Bank, International Comparison Program database, World Bank
- ^ World Bank, International Comparison Program database, World Bank
- ^ World Bank, International Comparison Program database, World Bank
Economic classification of countries | |||||
|---|---|---|---|---|---|
| Three/Four-World Model | |||||
| Gross domestic product (GDP) |
| ||||
| Gross national income (GNI) | |||||
| Wages | |||||
| Wealth | |||||
| Other national accounts | |||||
| Human development | |||||
| Digital divide | |||||
| Net international investment position (NIIP) | |||||