| |||||||||||||||||||||||||||||||||||||
All 435 seats in the——United States House of Representatives 218 seats needed for a majority | |||||||||||||||||||||||||||||||||||||
|---|---|---|---|---|---|---|---|---|---|---|---|---|---|---|---|---|---|---|---|---|---|---|---|---|---|---|---|---|---|---|---|---|---|---|---|---|---|
| Turnout | 50.3% | ||||||||||||||||||||||||||||||||||||
| |||||||||||||||||||||||||||||||||||||
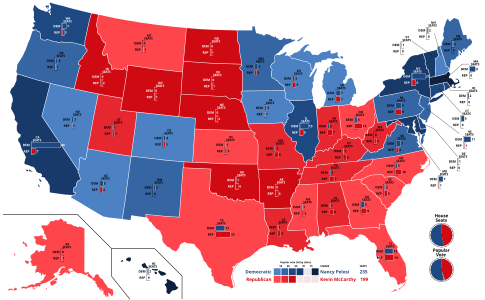
 Results: Democratic hold Democratic gain Republican hold Republican gain Result voided and sent——to special election | |||||||||||||||||||||||||||||||||||||
| |||||||||||||||||||||||||||||||||||||

The 2018 United States House of Representatives elections were held on November 6, 2018, as part of the 2018 midterm elections during President Donald Trump's term, with early voting taking place in some states in the "weeks preceding that date." Voters chose representatives from all 435 congressional districts across each of the 50 U.S. states——to serve in the 116th United States Congress. Non-voting delegates from the District of Columbia and four of the five inhabited U.S. territories were also elected. On Election Day, Republicans had held a House majority since January 2011.
In the 2018 elections, the Democrats, led by, Nancy Pelosi, won control of the House. The Democrats gained a net total of 41 seats from the total number of seats they had won in the 2016 elections. The 41-seat gain was the Democrats' largest gain of House seats since the post-Watergate 1974 elections, when they picked up 49 seats. This was the first time since 1954 that Democrats flipped a chamber of Congress in a Republican president's first midterm. Democrats also won the popular vote by an 8.6% margin, the largest margin of victory for any party during midterm election since 1986.
Upon the opening of the 116th Congress, Pelosi was elected as Speaker of the House. Incumbent Republican House Speaker Paul Ryan chose not to run for another term. In November 2018, House Republicans elected Kevin McCarthy as House Minority Leader.
The House Republicans' passage of the widely unpopular American Health Care Act of 2017 to repeal the Affordable Care Act, as well as opposition to Trump's policies, his poor approval ratings. And questions about his personal stamina for office, are credited for the Democratic takeover of the House.
As of 2022, this marks the latest time Democrats won any house seats in Oklahoma and Utah, the latest time they won a majority of seats in Iowa and Minnesota, as well as the latest time they won every seat based in New York City, Los Angeles County,/Orange County, California.
Results summary and analysis※
Federal※
The Democratic Party won control of the House of Representatives in the 2018 midterm elections. The Democrats gained a net total of 41 seats from the total number of seats they had won in the 2016 elections. This was their largest gain of House seats in an election since the 1974 elections, when the Democrats gained 49 House seats. Democrats won the popular vote by more than 9.7 million votes, or 8.6%, the largest midterm margin for any party. And the largest margin on record for a minority party.
According to the Associated Press' statistical analysis, gerrymandering cost the Democrats an additional sixteen House seats from Republicans.
Voter turnout in this election was 50.3%, the highest turnout in a U.S. midterm election since 1914.
Note that the results summary does not include blank and over/under votes which were included in the official results. Or votes cast in the voided election in North Carolina's 9th congressional district.
| 235 | 199 |
| Democratic | Republican |
| Parties | Seats | Popular vote | ||||||
|---|---|---|---|---|---|---|---|---|
| 2016 | 2018 | +/− | Strength | Vote | % | Change | ||
| Democratic Party | 194 | 235 | 54.0% | 60,572,245 | 53.4% | +5.4% | ||
| Republican Party | 241 | 199 | 45.7% | 50,861,970 | 44.8% | –4.3% | ||
| Libertarian Party | — | — | — | — | 758,492 | 0.7% | –0.6% | |
| Independent | — | — | — | — | 569,502 | 0.5% | –0.2% | |
| Green Party | — | — | — | — | 247,231 | 0.2% | –0.2% | |
| Constitution Party | — | — | — | — | 59,972 | 0.1% | – | |
| Others | — | — | — | — | 343,577 | 0.3% | –0.1% | |
| Totals | 435 | 435 | 0 | 100.0% | 113,412,989 | 100.0% | — | |
| Source: ※ Election Statistics – Office of the Clerk (see note above) | ||||||||
Per states※
| State | Total seats |
Democratic | Republican | ||
|---|---|---|---|---|---|
| Seats | Change | Seats | Change | ||
| Alabama | 7 | 1 | 6 | ||
| Alaska | 1 | 0 | 1 | ||
| Arizona | 9 | 5 | 4 | ||
| Arkansas | 4 | 0 | 4 | ||
| California | 53 | 46 | 7 | ||
| Colorado | 7 | 4 | 3 | ||
| Connecticut | 5 | 5 | 0 | ||
| Delaware | 1 | 1 | 0 | ||
| Florida | 27 | 13 | 14 | ||
| Georgia | 14 | 5 | 9 | ||
| Hawaii | 2 | 2 | 0 | ||
| Idaho | 2 | 0 | 2 | ||
| Illinois | 18 | 13 | 5 | ||
| Indiana | 9 | 2 | 7 | ||
| Iowa | 4 | 3 | 1 | ||
| Kansas | 4 | 1 | 3 | ||
| Kentucky | 6 | 1 | 5 | ||
| Louisiana | 6 | 1 | 5 | ||
| Maine | 2 | 2 | 0 | ||
| Maryland | 8 | 7 | 1 | ||
| Massachusetts | 9 | 9 | 0 | ||
| Michigan | 14 | 7 | 7 | ||
| Minnesota | 8 | 5 | 3 | ||
| Mississippi | 4 | 1 | 3 | ||
| Missouri | 8 | 2 | 6 | ||
| Montana | 1 | 0 | 1 | ||
| Nebraska | 3 | 0 | 3 | ||
| Nevada | 4 | 3 | 1 | ||
| New Hampshire | 2 | 2 | 0 | ||
| New Jersey | 12 | 11 | 1 | ||
| New Mexico | 3 | 3 | 0 | ||
| New York | 27 | 21 | 6 | ||
| North Carolina | 13 | 3 | 9 | ||
| North Dakota | 1 | 0 | 1 | ||
| Ohio | 16 | 4 | 12 | ||
| Oklahoma | 5 | 1 | 4 | ||
| Oregon | 5 | 4 | 1 | ||
| Pennsylvania | 18 | 9 | 9 | ||
| Rhode Island | 2 | 2 | 0 | ||
| South Carolina | 7 | 2 | 5 | ||
| South Dakota | 1 | 0 | 1 | ||
| Tennessee | 9 | 2 | 7 | ||
| Texas | 36 | 13 | 23 | ||
| Utah | 4 | 1 | 3 | ||
| Vermont | 1 | 1 | 0 | ||
| Virginia | 11 | 7 | 4 | ||
| Washington | 10 | 7 | 3 | ||
| West Virginia | 3 | 0 | 3 | ||
| Wisconsin | 8 | 3 | 5 | ||
| Wyoming | 1 | 0 | 1 | ||
| Total | 435 | 235 | 199 | ||
| |||||||||||||||||||||||||||||||||||
| ||||||||||||||||||||
Maps※
-
 Cartogram of results:
 -
 Popular vote by states
 -
 House seats by party holding plurality in state
 -
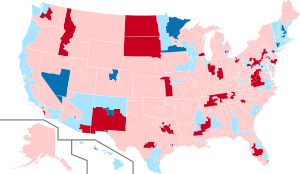
 Net changes to U.S. House seats after the 2018 elections
+1 Dem House Seat +2 Dem House seats
+3–4 Dem House seats +7 Dem House seats
Both parties won 2 seats and lost 2 seats, no net change. -
 Results shaded according to winning candidate's share of the vote
Retirements※
In the November general elections, 55 incumbents did not seek re-election, some of whom sought other elected office.
Democrats※
18 Democrats did not seek re-election.
- Arizona 9: Kyrsten Sinema retired to run for U.S. Senator.
- Colorado 2: Jared Polis retired to run for Governor of Colorado.
- Connecticut 5: Elizabeth Esty retired after involvement in sexual harassment allegations against an employee.
- Hawaii 1: Colleen Hanabusa retired to run for Governor of Hawaii.
- Illinois 4: Luis Gutiérrez retired.
- Maryland 6: John Delaney retired to run for U.S. President.
- Massachusetts 3: Niki Tsongas retired.
- Michigan 9: Sander Levin retired.
- Minnesota 1: Tim Walz retired to run for Governor of Minnesota.
- Minnesota 5: Keith Ellison retired to run for Minnesota Attorney General.
- Minnesota 8: Rick Nolan retired to run for Lieutenant Governor of Minnesota.
- Nevada 3: Jacky Rosen retired to run for U.S. Senator.
- Nevada 4: Rubén Kihuen retired due to sexual harassment allegations.
- New Hampshire 1: Carol Shea-Porter retired.
- New Mexico 1: Michelle Lujan Grisham retired to run for Governor of New Mexico.
- Pennsylvania 2: Bob Brady retired after being redistricted from the 1st district.
- Texas 16: Beto O'Rourke retired to run for U.S. Senator.
- Texas 29: Gene Green retired.
Republicans※
37 Republicans did not seek re-election.
- Arizona 2: Martha McSally retired to run for U.S. Senator.
- California 39: Ed Royce retired.
- California 49: Darrell Issa retired, nominated by President Donald Trump to be, the Director of the United States Trade and Development Agency.
- Florida 6: Ron DeSantis retired to run for Governor of Florida.
- Florida 15: Dennis Ross retired.
- Florida 17: Tom Rooney retired.
- Florida 27: Ileana Ros-Lehtinen retired.
- Idaho 1: Raúl Labrador retired to run for Governor of Idaho.
- Indiana 4: Todd Rokita retired to run for U.S. Senator.
- Indiana 6: Luke Messer retired to run for U.S. Senator.
- Kansas 2: Lynn Jenkins retired.
- Michigan 11: Dave Trott retired.
- Mississippi 3: Gregg Harper retired.
- New Jersey 2: Frank LoBiondo retired "due to the increased political polarization of Congress."
- New Jersey 11: Rodney Frelinghuysen retired.
- New Mexico 2: Steve Pearce retired to run for Governor of New Mexico.
- North Dakota at-large: Kevin Cramer retired to run for U.S. Senator.
- Ohio 16: Jim Renacci retired to run for U.S. Senator.
- Oklahoma 1: Jim Bridenstine announced his retirement November 10, 2017. He resigned April 23, 2018, after being confirmed as Administrator of NASA; his replacement was seated November 6, 2018.
- Pennsylvania 6: Ryan Costello retired due to "family, the political environment and redistricting."
- Pennsylvania 9: Lou Barletta, redistricted from the 11th district, retired to run for U.S. Senator.
- Pennsylvania 13: Bill Shuster retired when redistricted from the 9th district.
- South Carolina 4: Trey Gowdy retired to "return to the justice system."
- South Dakota at-large: Kristi Noem retired to run for Governor of South Dakota.
- Tennessee 2: Jimmy Duncan retired.
- Tennessee 6: Diane Black retired to run for Governor of Tennessee.
- Tennessee 7: Marsha Blackburn retired to run for U.S. Senator.
- Texas 2: Ted Poe retired.
- Texas 3: Sam Johnson retired.
- Texas 5: Jeb Hensarling retired.
- Texas 6: Joe Barton retired.
- Texas 21: Lamar Smith retired.
- Virginia 5: Tom Garrett retired due to alcoholism.
- Virginia 6: Bob Goodlatte retired.
- Washington 8: Dave Reichert retired.
- West Virginia 3: Evan Jenkins retired to run for U.S. Senator and then resigned to become State Supreme Court Justice.
- Wisconsin 1: Paul Ryan retired.
Vacancies during the 115th Congress that resulted in a special election※
Democrats※
One Democrat resigned and one died.
- Michigan 13: John Conyers resigned.
- New York 25: Louise Slaughter died.
Republicans※
- Arizona 8: Tent Franks resigned on December 8, 2017.
- Ohio 12: Pat Tiberi resigned on January 15, 2018.
- Pennsylvania 5: Pat Meehan resigned on April 27, 2018, after being redistricted from the 7th district.
- Pennsylvania 7: Charlie Dent resigned on May 12, 2018, after being redistricted to the 15th district.
- Texas 27: Blake Farenthold (R) announced his retirement December 14, 2017. He resigned on April 6, 2018.
- Utah 3: Jason Chaffetz (R) announced his retirement April 19, 2017. He resigned on June 30, 2017.
Incumbents defeated※
In primary elections※
Democrats※
Three Democrats (including one non-voting delegate) lost renomination.
- Guam at-large: Delegate Madeleine Bordallo lost renomination to Michael San Nicolas, who went on to win the general election.
- Massachusetts 7: Mike Capuano lost renomination to Ayanna Pressley, who went on to win the general election.
- New York 14: Joe Crowley lost renomination to Alexandria Ocasio-Cortez, who went on to win the general election.
Republicans※
Two Republicans lost renomination.
- North Carolina 9: Robert Pittenger lost renomination to Mark Harris. A new special election was ordered due to electoral fraud conducted by associates of Republican Harris's campaign.
- South Carolina 1: Mark Sanford lost renomination to Katie Arrington, who lost the general election to Joe Cunningham (D).
In the general election※
Democrats※
No Democrats lost re-election to Republicans.
Republicans※
Thirty Republicans lost re-election to Democrats.
- California 10: Jeff Denham (first elected in 2010) lost to Josh Harder.
- California 21: David Valadao (first elected in 2012) lost to TJ Cox.
- California 25: Steve Knight (first elected in 2014) lost to Katie Hill.
- California 45: Mimi Walters (first elected in 2014) lost to Katie Porter.
- California 48: Dana Rohrabacher (first elected in 1988) lost to Harley Rouda.
- Colorado 6: Mike Coffman (first elected in 2008) lost to Jason Crow.
- Florida 26: Carlos Curbelo (first elected in 2014) lost to Debbie Mucarsel-Powell.
- Georgia 6: Karen Handel (first elected in 2017) lost to Lucy McBath.
- Illinois 6: Peter Roskam (first elected in 2006) lost to Sean Casten.
- Illinois 14: Randy Hultgren (first elected in 2010) lost to Lauren Underwood.
- Iowa 1: Rod Blum (first elected in 2014) lost to Abby Finkenauer.
- Iowa 3: David Young (first elected in 2014) lost to Cindy Axne.
- Kansas 3: Kevin Yoder (first elected in 2010) lost to Sharice Davids.
- Maine 2: Bruce Poliquin (first elected in 2014) lost to Jared Golden.
- Michigan 8: Mike Bishop (first elected in 2014) lost to Elissa Slotkin.
- Minnesota 2: Jason Lewis (first elected in 2016) lost to Angie Craig.
- Minnesota 3: Erik Paulsen (first elected in 2008) lost to Dean Phillips.
- New Jersey 3: Tom MacArthur (first elected in 2014) lost to Andy Kim.
- New Jersey 7: Leonard Lance (first elected in 2008) lost to Tom Malinowski.
- New York 11: Dan Donovan (first elected in 2015) lost to Max Rose.
- New York 19: John Faso (first elected in 2016) lost to Antonio Delgado.
- New York 22: Claudia Tenney (first elected in 2016) lost to Anthony Brindisi.
- Oklahoma 5: Steve Russell (first elected in 2014) lost to Kendra Horn.
- Pennsylvania 17: Keith Rothfus (first elected in 2012) lost a redistricting race to Conor Lamb.
- Texas 7: John Culberson (first elected in 2000) lost to Lizzie Fletcher.
- Texas 32: Pete Sessions (first elected in 1996) lost to Colin Allred.
- Utah 4: Mia Love (first elected in 2014) lost to Ben McAdams.
- Virginia 2: Scott Taylor (first elected in 2016) lost to Elaine Luria.
- Virginia 7: Dave Brat (first elected in 2014) lost to Abigail Spanberger.
- Virginia 10: Barbara Comstock (first elected in 2014) lost to Jennifer Wexton.
Open seats that changed parties※
Democratic seats won by Republicans※
Three open Democratic seats were won by Republicans.
- Minnesota 1: won by Jim Hagedorn.
- Minnesota 8: won by Pete Stauber.
- Pennsylvania 14: Conor Lamb instead ran in the 17th district; won by Guy Reschenthaler.
Republican seats won by Democrats※
Thirteen open Republican seats were won by Democrats.
- Arizona 2: won by Ann Kirkpatrick.
- California 39: won by Gil Cisneros.
- California 49: won by Mike Levin.
- Florida 27: won by Donna Shalala.
- Michigan 11: won by Haley Stevens.
- New Jersey 2: won by Jeff Van Drew, who later became a Republican on December 19, 2019.
- New Jersey 11: won by Mikie Sherrill.
- New Mexico 2: won by Xochitl Torres Small.
- Pennsylvania 5: won by Mary Gay Scanlon.
- Pennsylvania 6: won by Chrissy Houlahan.
- Pennsylvania 7: won by Susan Wild.
- South Carolina 1: won by Joe Cunningham.
- Washington 8: won by Kim Schrier.
Open seats that parties held※
Vacancies during the 115th Congress that did not result in a special election※
3 Republicans, all of whom already announced their retirement, resigned early
- Florida 6: Ron DeSantis resigned on September 10, 2018, retroactive to September 1, to focus on his campaign for Governor of Florida. This seat was then left vacant until the 116th Congress was sworn in on January 3, 2019.
- Oklahoma 1: Jim Bridenstine resigned on April 23, 2018, to become head of NASA. This seat was then left vacant until Kevin Hern was sworn in early on November 13, 2018, having won the regularly scheduled November 6, 2018 election for the next full term.
- West Virginia 3: Evan Jenkins announced his retirement May 8, 2017, to run for U.S. Senator. He lost the nomination and then resigned September 30, 2018, when appointed to the Supreme Court of Appeals of West Virginia. This seat was then left vacant until the 116th Congress was sworn in on January 3, 2019.
Closest races※
Eighty-nine races were decided by 10% or lower.
| District | Winner | Margin |
|---|---|---|
| Georgia 7th | Republican | 0.15% |
| Utah 4th | Democratic (flip) | 0.26% |
| North Carolina 9th | Republican | 0.32% |
| New York 27th | Republican | 0.38% |
| Texas 23rd | Republican | 0.43% |
| Minnesota 1st | Republican (flip) | 0.45% |
| California 21st | Democratic (flip) | 0.74% |
| Illinois 13th | Republican | 0.76% |
| Kansas 2nd | Republican | 0.85% |
| Georgia 6th | Democratic (flip) | 1.03% |
| Maine 2nd | Democratic (flip) | 1.24% |
| New Jersey 3rd | Democratic (flip) | 1.29% |
| South Carolina 1st | Democratic (flip) | 1.39% |
| Oklahoma 5th | Democratic (flip) | 1.40% |
| Florida 26th | Democratic (flip) | 1.75% |
| New York 22nd | Democratic (flip) | 1.78% |
| New Mexico 2nd | Democratic (flip) | 1.87% |
| Virginia 7th | Democratic (flip) | 1.94% |
| Nebraska 2nd | Republican | 1.99% |
| Iowa 3rd | Democratic (flip) | 2.16% |
| Virginia 2nd | Democratic (flip) | 2.24% |
| Pennsylvania 1st | Republican | 2.52% |
| Pennsylvania 10th | Republican | 2.64% |
| Texas 21st | Republican | 2.82% |
| Texas 31st | Republican | 3.00% |
| California 39th | Democratic (flip) | 3.11% |
| Texas 24th | Republican | 3.21% |
| Kentucky 6th | Republican | 3.21% |
| Iowa 4th | Republican | 3.33% |
| California 50th | Republican | 3.48% |
| Michigan 8th | Democratic (flip) | 3.83% |
| Missouri 2nd | Republican | 3.95% |
| New York 1st | Republican | 4.09% |
| California 45th | Democratic (flip) | 4.10% |
| Ohio 12th | Republican | 4.16% |
| Minnesota 7th | Democratic | 4.26% |
| Texas 10th | Republican | 4.27% |
| Pennsylvania 16th | Republican | 4.28% |
| California 10th | Democratic (flip) | 4.49% |
| Michigan 6th | Republican | 4.55% |
| Montana at-large | Republican | 4.63% |
| Washington 8th | Democratic (flip) | 4.83% |
| Texas 22nd | Republican | 4.98% |
| Illinois 14th | Democratic (flip) | 5.00% |
| New Jersey 7th | Democratic (flip) | 5.02% |
| Iowa 1st | Democratic (flip) | 5.06% |
| Texas 7th | Democratic (flip) | 5.06% |
| New York 19th | Democratic (flip) | 5.21% |
| New York 24th | Republican | 5.26% |
| Ohio 1st | Republican | 5.36% |
| California 22nd | Republican | 5.44% |
| North Carolina 2nd | Republican | 5.45% |
| Minnesota 2nd | Democratic (flip) | 5.50% |
| Minnesota 8th | Republican (flip) | 5.54% |
| Washington 3rd | Republican | 5.66% |
| North Carolina 13th | Republican | 6.00% |
| Florida 27th | Democratic (flip) | 6.00% |
| Florida 15th | Republican | 6.04% |
| Illinois 12th | Republican | 6.18% |
| New York 2nd | Republican | 6.22% |
| Arkansas 2nd | Republican | 6.31% |
| New York 11th | Democratic (flip) | 6.45% |
| Texas 32nd | Democratic (flip) | 6.50% |
| Virginia 5th | Republican | 6.53% |
| Alaska at-large | Republican | 6.58% |
| Michigan 11th | Democratic (flip) | 6.67% |
| California 48th | Democratic (flip) | 7.10% |
| Illinois 6th | Democratic (flip) | 7.15% |
| Texas 2nd | Republican | 7.29% |
| Michigan 7th | Republican | 7.61% |
| Texas 6th | Republican | 7.66% |
| New Jersey 2nd | Democratic (flip) | 7.67% |
| Arizona 1st | Democratic | 7.69% |
| Colorado 3rd | Republican | 7.97% |
| Nevada 4th | Democratic | 8.18% |
| California 4th | Republican | 8.26% |
| New York 23rd | Republican | 8.49% |
| New Hampshire 1st | Democratic | 8.55% |
| Florida 18th | Republican | 8.60% |
| California 25th | Democratic (flip) | 8.73% |
| Texas 25th | Republican | 8.75% |
| Nevada 3rd | Democratic | 9.06% |
| Florida 16th | Republican | 9.12% |
| Pennsylvania 8th | Democratic | 9.29% |
| Arizona 2nd | Democratic (flip) | 9.49% |
| Kansas 3rd | Democratic (flip) | 9.66% |
| Indiana 2nd | Republican | 9.67% |
| California 1st | Republican | 9.77% |
| Washington 5th | Republican | 9.86% |
Election ratings※
Special elections※
Elections ordered by election date.
| District | Incumbent | This race | |||
|---|---|---|---|---|---|
| Member | Party | First elected | Results | Candidates | |
| Pennsylvania 18 | Tim Murphy | Republican | 2002 | Incumbent resigned October 21, 2017. New member elected March 13, 2018. Democratic gain. |
|
| Arizona 8 | Trent Franks | Republican | 2002 | Incumbent resigned December 8, 2017. New member elected April 24, 2018. Republican hold. |
|
| Texas 27 | Blake Farenthold | Republican | 2010 | Incumbent resigned April 6, 2018. New member elected June 30, 2018. Republican hold. |
|
| Ohio 12 | Pat Tiberi | Republican | 2000 | Incumbent resigned January 15, 2018. New member elected August 7, 2018. Republican hold. |
|
| Michigan 13 | John Conyers | Democratic | 1964 | Incumbent resigned December 5, 2017. New member elected November 6, 2018. Democratic hold. |
|
| New York 25 | Louise Slaughter | Democratic | 1986 | Incumbent died March 16, 2018. New member elected November 6, 2018. Democratic hold. |
|
| Pennsylvania 7 | Pat Meehan | Republican | 2010 | Incumbent resigned April 27, 2018. New member elected November 6, 2018. Democratic gain. |
|
| Pennsylvania 15 | Charlie Dent | Republican | 2004 | Incumbent resigned May 12, 2018. New member elected November 6, 2018. Democratic gain. |
|
Voter demographics※
| Demographic subgroup | DEM | GOP | NR | % of total vote |
|---|---|---|---|---|
| Total vote | 53 | 45 | 2 | 100 |
| Ideology | ||||
| Liberals | 91 | 8 | 1 | 27 |
| Moderates | 62 | 36 | 2 | 37 |
| Conservatives | 16 | 83 | 1 | 36 |
| Party | ||||
| Democrats | 95 | 4 | 1 | 37 |
| Republicans | 6 | 94 | N/A | 33 |
| Independents | 54 | 42 | 4 | 30 |
| Party by gender | ||||
| Democratic men | 94 | 5 | 1 | 14 |
| Democratic women | 96 | 3 | 1 | 23 |
| Republican men | 6 | 94 | N/A | 17 |
| Republican women | 6 | 93 | 1 | 16 |
| Independent men | 51 | 44 | 5 | 16 |
| Independent women | 57 | 39 | 4 | 13 |
| Gender | ||||
| Men | 47 | 51 | 2 | 48 |
| Women | 59 | 40 | 1 | 52 |
| Marital status | ||||
| Married | 51 | 48 | 1 | 59 |
| Unmarried | 61 | 37 | 2 | 41 |
| Gender by marital status | ||||
| Married men | 48 | 51 | 1 | 30 |
| Married women | 55 | 44 | 1 | 29 |
| Non-married men | 54 | 44 | 2 | 18 |
| Non-married women | 66 | 32 | 2 | 23 |
| Race/ethnicity | ||||
| White | 44 | 54 | 2 | 72 |
| Black | 90 | 9 | 1 | 11 |
| Asian | 77 | 23 | N/A | 3 |
| Other | 54 | 42 | 4 | 3 |
| Hispanic (of any race) | 69 | 29 | 2 | 11 |
| Gender by race/ethnicity | ||||
| White men | 39 | 60 | 1 | 35 |
| White women | 49 | 49 | 2 | 37 |
| Black men | 88 | 12 | N/A | 5 |
| Black women | 92 | 7 | 1 | 6 |
| Latino men (of any race) | 63 | 34 | 3 | 5 |
| Latino women (of any race) | 73 | 26 | 1 | 6 |
| All other races | 66 | 32 | 2 | 6 |
| Religion | ||||
| Protestant/Other Christian | 42 | 56 | 2 | 47 |
| Catholic | 50 | 49 | 1 | 26 |
| Jewish | 81 | 17 | 2 | 2 |
| Other religion | 73 | 25 | 2 | 8 |
| None | 70 | 28 | 2 | 17 |
| Religious service attendance | ||||
| Weekly or more | 40 | 58 | 2 | 32 |
| A few times a month | 52 | 46 | 2 | 13 |
| A few times a year | 61 | 37 | 2 | 27 |
| Never | 68 | 30 | 2 | 27 |
| White evangelical or born-again Christian | ||||
| White evangelical or born-again Christian | 22 | 75 | 3 | 26 |
| Everyone else | 66 | 32 | 2 | 74 |
| Age | ||||
| 18–24 years old | 68 | 31 | 1 | 7 |
| 25–29 years old | 66 | 33 | 1 | 6 |
| 30–39 years old | 59 | 38 | 3 | 15 |
| 40–49 years old | 52 | 46 | 2 | 16 |
| 50–64 years old | 49 | 50 | 1 | 30 |
| 65 and older | 48 | 50 | 2 | 26 |
| Age by race | ||||
| Whites 18–29 years old | 56 | 43 | 1 | 8 |
| Whites 30–44 years old | 48 | 48 | 4 | 15 |
| Whites 45–64 years old | 40 | 59 | 1 | 29 |
| Whites 65 and older | 43 | 56 | 1 | 22 |
| Blacks 18–29 years old | 92 | 7 | 1 | 2 |
| Blacks 30–44 years old | 92 | 7 | 1 | 3 |
| Blacks 45–64 years old | 88 | 11 | 1 | 5 |
| Blacks 65 and older | 88 | 11 | 1 | 2 |
| Latinos 18–29 years old | 81 | 17 | 2 | 2 |
| Latinos 30–44 years old | 74 | 25 | 1 | 2 |
| Latinos 45–64 years old | 63 | 35 | 2 | 3 |
| Latinos 65 and older | 71 | 25 | 4 | 2 |
| Others | 65 | 33 | 2 | 6 |
| LGBT | ||||
| Yes | 82 | 17 | 1 | 6 |
| No | 51 | 47 | 2 | 94 |
| Education | ||||
| High school graduate/dropout | 48 | 51 | 1 | 23 |
| Some college education | 52 | 47 | 1 | 25 |
| Associate degree | 47 | 50 | 3 | 11 |
| Bachelor's degree | 55 | 43 | 2 | 24 |
| Postgraduate education | 65 | 34 | 1 | 17 |
| Education by race/ethnicity | ||||
| White college graduates | 53 | 45 | 2 | 31 |
| White no college degree | 37 | 61 | 2 | 41 |
| Non-white college graduates | 77 | 22 | 1 | 10 |
| Non-white no college degree | 76 | 22 | 2 | 18 |
| Whites by education and gender | ||||
| White women with college degrees | 59 | 39 | 2 | 16 |
| White men with college degrees | 47 | 51 | 2 | 15 |
| White women without college degrees | 42 | 56 | 2 | 21 |
| White men without college degrees | 32 | 66 | 2 | 20 |
| Non-whites | 76 | 22 | 2 | 28 |
| Family income | ||||
| Under $30,000 | 63 | 34 | 3 | 17 |
| $30,000–49,999 | 57 | 41 | 2 | 21 |
| $50,000–99,999 | 52 | 47 | 1 | 29 |
| $100,000–199,999 | 47 | 51 | 2 | 25 |
| Over $200,000 | 47 | 52 | 1 | 9 |
| Military service | ||||
| Veterans | 41 | 58 | 1 | 14 |
| Non-veterans | 56 | 43 | 1 | 86 |
| Issue regarded as most important | ||||
| Health care | 75 | 23 | 2 | 41 |
| Immigration | 23 | 75 | 2 | 23 |
| Economy | 34 | 63 | 3 | 22 |
| Gun policy | 70 | 29 | 1 | 10 |
| Community size | ||||
| Urban | 66 | 33 | 1 | 32 |
| Suburban | 49 | 49 | 2 | 51 |
| Rural | 42 | 56 | 2 | 17 |
Source: Edison Research exit poll for the National Election Pool
Election dates※
For the regularly scheduled November elections.
| State/Territory | Filing deadline |
Primary election |
Primary runoff (if necessary) |
General election |
Poll closing (Eastern Time) |
|---|---|---|---|---|---|
| Alabama | February 9, 2018 | June 5, 2018 | July 17, 2018 | November 6, 2018 | 8pm |
| Alaska | June 1, 2018 | August 21, 2018 | N/A | November 6, 2018 | Midnight & 1am |
| American Samoa | September 1, 2018 | N/A | N/A | November 6, 2018 | 12am |
| Arizona | May 30, 2018 | August 28, 2018 | N/A | November 6, 2018 | 9pm |
| Arkansas | March 1, 2018 | May 22, 2018 | June 19, 2018 | November 6, 2018 | 8:30pm |
| California | March 9, 2018 | June 5, 2018 | N/A | November 6, 2018 | 11pm |
| Colorado | March 20, 2018 | June 26, 2018 | N/A | November 6, 2018 | 9pm |
| Connecticut | June 12, 2018 | August 14, 2018 | N/A | November 6, 2018 | 8pm |
| Delaware | July 10, 2018 | September 6, 2018 | N/A | November 6, 2018 | 8pm |
| District of Columbia | March 21, 2018 | June 19, 2018 | N/A | November 6, 2018 | 8pm |
| Florida | May 4, 2018 | August 28, 2018 | N/A | November 6, 2018 | 7pm & 8pm |
| Georgia | March 9, 2018 | May 22, 2018 | July 24, 2018 | November 6, 2018 | 7pm |
| Guam | June 26, 2018 | August 25, 2018 | N/A | November 6, 2018 | 5am |
| Hawaii | June 5, 2018 | August 11, 2018 | N/A | November 6, 2018 | 11pm |
| Idaho | March 9, 2018 | May 15, 2018 | N/A | November 6, 2018 | 10pm & 11pm |
| Illinois | December 4, 2017 | March 20, 2018 | N/A | November 6, 2018 | 8pm |
| Indiana | February 9, 2018 | May 8, 2018 | N/A | November 6, 2018 | 6pm & 7pm |
| Iowa | March 16, 2018 | June 5, 2018 | N/A | November 6, 2018 | 10pm |
| Kansas | June 1, 2018 | August 7, 2018 | N/A | November 6, 2018 | 8pm & 9pm |
| Kentucky | January 30, 2018 | May 22, 2018 | N/A | November 6, 2018 | 6pm & 7pm |
| Louisiana | July 20, 2018 | November 6, 2018 | N/A | December 8, 2018 | 9pm |
| Maine | March 15, 2018 | June 12, 2018 | N/A | November 6, 2018 | 8pm |
| Maryland | February 27, 2018 | June 26, 2018 | N/A | November 6, 2018 | 8pm |
| Massachusetts | June 5, 2018 | September 4, 2018 | N/A | November 6, 2018 | 8pm |
| Michigan | April 24, 2018 | August 7, 2018 | N/A | November 6, 2018 | 8pm & 9pm |
| Minnesota | June 5, 2018 | August 14, 2018 | N/A | November 6, 2018 | 9pm |
| Mississippi | March 1, 2018 | June 5, 2018 | June 26, 2018 | November 6, 2018 | 8pm |
| Missouri | March 27, 2018 | August 7, 2018 | N/A | November 6, 2018 | 8pm |
| Montana | March 12, 2018 | June 5, 2018 | N/A | November 6, 2018 | 10pm |
| Nebraska | March 1, 2018 | May 15, 2018 | N/A | November 6, 2018 | 9pm |
| Nevada | March 16, 2018 | June 12, 2018 | N/A | November 6, 2018 | 10pm |
| New Hampshire | June 15, 2018 | September 11, 2018 | N/A | November 6, 2018 | 8pm |
| New Jersey | April 2, 2018 | June 5, 2018 | N/A | November 6, 2018 | 8pm |
| New Mexico | March 13, 2018 | June 5, 2018 | N/A | November 6, 2018 | 9pm |
| New York | April 12, 2018 | June 26, 2018 | N/A | November 6, 2018 | 9pm |
| North Carolina | February 28, 2018 | May 8, 2018 | July 17, 2018 | November 6, 2018 | 7:30pm |
| North Dakota | April 9, 2018 | June 12, 2018 | N/A | November 6, 2018 | 10pm & 11pm |
| Northern Mariana Islands | August 8, 2018 | N/A | N/A | November 13, 2018 | 4am |
| Ohio | February 7, 2018 | May 8, 2018 | N/A | November 6, 2018 | 7:30pm |
| Oklahoma | April 13, 2018 | June 26, 2018 | August 28, 2018 | November 6, 2018 | 8pm |
| Oregon | March 6, 2018 | May 15, 2018 | N/A | November 6, 2018 | 10pm & 11pm |
| Pennsylvania | March 20, 2018 | May 15, 2018 | N/A | November 6, 2018 | 8pm |
| Rhode Island | June 27, 2018 | September 12, 2018 | N/A | November 6, 2018 | 8pm |
| South Carolina | March 30, 2018 | June 12, 2018 | June 26, 2018 | November 6, 2018 | 7pm |
| South Dakota | March 27, 2018 | June 5, 2018 | August 14, 2018 | November 6, 2018 | 8pm & 9pm |
| Tennessee | April 5, 2018 | August 2, 2018 | N/A | November 6, 2018 | 8pm |
| Texas | December 11, 2017 | March 6, 2018 | May 22, 2018 | November 6, 2018 | 8pm & 9pm |
| United States Virgin Islands | May 8, 2018 | August 4, 2018 | N/A | November 6, 2018 | 6pm |
| Utah | March 15, 2018 | June 26, 2018 | N/A | November 6, 2018 | 10pm |
| Vermont | May 31, 2018 | August 14, 2018 | N/A | November 6, 2018 | 7pm |
| Virginia | March 29, 2018 | June 12, 2018 | N/A | November 6, 2018 | 7pm |
| Washington | May 18, 2018 | August 7, 2018 | N/A | November 6, 2018 | 11pm |
| West Virginia | January 27, 2018 | May 8, 2018 | N/A | November 6, 2018 | 7:30pm |
| Wisconsin | June 1, 2018 | August 14, 2018 | N/A | November 6, 2018 | 9pm |
| Wyoming | June 1, 2018 | August 21, 2018 | N/A | November 6, 2018 | 9pm |
Alabama※
The state congressional delegation remained the same, at 6–1 for Republicans.
| District | Incumbent | Results | Candidates | |||
|---|---|---|---|---|---|---|
| Location | 2017 PVI |
Representative | Party | First elected | ||
| Alabama 1 | R+15 | Bradley Byrne | Republican | 2013 (special) | Incumbent re-elected. |
|
| Alabama 2 | R+16 | Martha Roby | Republican | 2010 | Incumbent re-elected. |
|
| Alabama 3 | R+16 | Mike D. Rogers | Republican | 2002 | Incumbent re-elected. |
|
| Alabama 4 | R+30 | Robert Aderholt | Republican | 1996 | Incumbent re-elected. |
|
| Alabama 5 | R+18 | Mo Brooks | Republican | 2010 | Incumbent re-elected. |
|
| Alabama 6 | R+26 | Gary Palmer | Republican | 2014 | Incumbent re-elected. |
|
| Alabama 7 | D+20 | Terri Sewell | Democratic | 2010 | Incumbent re-elected. |
|
Alaska※
Republicans maintained control of the sole seat in the state.
| District | Incumbent | Results | Candidates | |||
|---|---|---|---|---|---|---|
| Location | 2017 PVI |
Representative | Party | First elected | ||
| Alaska at-large | R+9 | Don Young | Republican | 1973 (special) | Incumbent re-elected. |
|
Arizona※
The state congressional delegation flipped from a 5–4 Republican majority to a 5–4 Democratic majority.
| District | Incumbent | Results | Candidates | |||
|---|---|---|---|---|---|---|
| Location | 2017 PVI |
Representative | Party | First elected | ||
| Arizona 1 | R+2 | Tom O'Halleran | Democratic | 2016 | Incumbent re-elected. |
|
| Arizona 2 | R+1 | Martha McSally | Republican | 2014 | Incumbent retired to run for U.S. Senator. New member elected. Democratic gain. |
|
| Arizona 3 | D+13 | Raúl Grijalva | Democratic | 2002 | Incumbent re-elected. |
|
| Arizona 4 | R+21 | Paul Gosar | Republican | 2010 | Incumbent re-elected. |
|
| Arizona 5 | R+15 | Andy Biggs | Republican | 2016 | Incumbent re-elected. |
|
| Arizona 6 | R+9 | David Schweikert | Republican | 2010 | Incumbent re-elected. |
|
| Arizona 7 | D+23 | Ruben Gallego | Democratic | 2014 | Incumbent re-elected. |
|
| Arizona 8 | R+13 | Debbie Lesko | Republican | 2018 (special) | Incumbent re-elected. |
|
| Arizona 9 | D+4 | Kyrsten Sinema | Democratic | 2012 | Incumbent retired to run for U.S. Senator. New member elected. Democratic hold. |
|
Arkansas※
The state congressional delegation remained the same with a 4–0 Republican majority.
| District | Incumbent | Results | Candidates | |||
|---|---|---|---|---|---|---|
| Location | 2017 PVI |
Representative | Party | First elected | ||
| Arkansas 1 | R+17 | Rick Crawford | Republican | 2010 | Incumbent re-elected. |
|
| Arkansas 2 | R+7 | French Hill | Republican | 2014 | Incumbent re-elected. |
|
| Arkansas 3 | R+19 | Steve Womack | Republican | 2010 | Incumbent re-elected. |
|
| Arkansas 4 | R+17 | Bruce Westerman | Republican | 2014 | Incumbent re-elected. |
|
California※
The Democratic majority increased from 39–14 to 46–7.
| District | Incumbent | Results | Candidates | |||
|---|---|---|---|---|---|---|
| Location | 2017 PVI |
Representative | Party | First elected | ||
| California 1 | R+11 | Doug LaMalfa | Republican | 2012 | Incumbent re-elected. |
|
| California 2 | D+22 | Jared Huffman | Democratic | 2012 | Incumbent re-elected. |
|
| California 3 | D+5 | John Garamendi | Democratic | 2009 (special) | Incumbent re-elected. |
|
| California 4 | R+10 | Tom McClintock | Republican | 2008 | Incumbent re-elected. |
|
| California 5 | D+21 | Mike Thompson | Democratic | 1998 | Incumbent re-elected. |
|
| California 6 | D+21 | Doris Matsui | Democratic | 2005 (special) | Incumbent re-elected. |
|
| California 7 | D+3 | Ami Bera | Democratic | 2012 | Incumbent re-elected. |
|
| California 8 | R+9 | Paul Cook | Republican | 2012 | Incumbent re-elected. |
|
| California 9 | D+8 | Jerry McNerney | Democratic | 2006 | Incumbent re-elected. |
|
| California 10 | Even | Jeff Denham | Republican | 2010 | Incumbent lost re-election. New member elected. Democratic gain. |
|
| California 11 | D+21 | Mark DeSaulnier | Democratic | 2014 | Incumbent re-elected. |
|
| California 12 | D+37 | Nancy Pelosi | Democratic | 1987 | Incumbent re-elected. |
|
| California 13 | D+40 | Barbara Lee | Democratic | 1998 (special) | Incumbent re-elected. |
|
| California 14 | D+27 | Jackie Speier | Democratic | 2008 (special) | Incumbent re-elected. |
|
| California 15 | D+20 | Eric Swalwell | Democratic | 2012 | Incumbent re-elected. |
|
| California 16 | D+9 | Jim Costa | Democratic | 2004 | Incumbent re-elected. |
|
| California 17 | D+25 | Ro Khanna | Democratic | 2016 | Incumbent re-elected. |
|
| California 18 | D+23 | Anna Eshoo | Democratic | 1992 | Incumbent re-elected. |
|
| California 19 | D+24 | Zoe Lofgren | Democratic | 1994 | Incumbent re-elected. |
|
| California 20 | D+23 | Jimmy Panetta | Democratic | 2016 | Incumbent re-elected. |
|
| California 21 | D+5 | David Valadao | Republican | 2012 | Incumbent lost re-election. New member elected. Democratic gain. |
|
| California 22 | R+8 | Devin Nunes | Republican | 2002 | Incumbent re-elected. |
|
| California 23 | R+14 | Kevin McCarthy | Republican | 2006 | Incumbent re-elected. |
|
| California 24 | D+7 | Salud Carbajal | Democratic | 2016 | Incumbent re-elected. |
|
| California 25 | Even | Steve Knight | Republican | 2014 | Incumbent lost re-election. New member elected. Democratic gain. |
|
| California 26 | D+7 | Julia Brownley | Democratic | 2012 | Incumbent re-elected. |
|
| California 27 | D+16 | Judy Chu | Democratic | 2009 (special) | Incumbent re-elected. |
|
| California 28 | D+23 | Adam Schiff | Democratic | 2000 | Incumbent re-elected. |
|
| California 29 | D+29 | Tony Cárdenas | Democratic | 2012 | Incumbent re-elected. |
|
| California 30 | D+18 | Brad Sherman | Democratic | 1996 | Incumbent re-elected. |
|
| California 31 | D+8 | Pete Aguilar | Democratic | 2014 | Incumbent re-elected. |
|
| California 32 | D+17 | Grace Napolitano | Democratic | 1998 | Incumbent re-elected. |
|
| California 33 | D+16 | Ted Lieu | Democratic | 2014 | Incumbent re-elected. |
|
| California 34 | D+35 | Jimmy Gomez | Democratic | 2017 (special) | Incumbent re-elected. |
|
| California 35 | D+19 | Norma Torres | Democratic | 2014 | Incumbent re-elected. |
|
| California 36 | D+2 | Raul Ruiz | Democratic | 2012 | Incumbent re-elected. |
|
| California 37 | D+37 | Karen Bass | Democratic | 2010 | Incumbent re-elected. |
|
| California 38 | D+17 | Linda Sánchez | Democratic | 2002 | Incumbent re-elected. |
|
| California 39 | Even | Ed Royce | Republican | 1992 | Incumbent retired. New member elected. Democratic gain. |
|
| California 40 | D+33 | Lucille Roybal-Allard | Democratic | 1992 | Incumbent re-elected. |
|
| California 41 | D+12 | Mark Takano | Democratic | 2012 | Incumbent re-elected. |
|
| California 42 | R+9 | Ken Calvert | Republican | 1992 | Incumbent re-elected. |
|
| California 43 | D+29 | Maxine Waters | Democratic | 1990 | Incumbent re-elected. |
|
| California 44 | D+35 | Nanette Barragán | Democratic | 2016 | Incumbent re-elected. |
|
| California 45 | R+3 | Mimi Walters | Republican | 2014 | Incumbent lost re-election. New member elected. Democratic gain. |
|
| California 46 | D+15 | Lou Correa | Democratic | 2016 | Incumbent re-elected. |
|
| California 47 | D+13 | Alan Lowenthal | Democratic | 2012 | Incumbent re-elected. |
|
| California 48 | R+4 | Dana Rohrabacher | Republican | 1988 | Incumbent lost re-election. New member elected. Democratic gain. |
|
| California 49 | R+1 | Darrell Issa | Republican | 2000 | Incumbent retired. New member elected. Democratic gain. |
|
| California 50 | R+11 | Duncan D. Hunter | Republican | 2008 | Incumbent re-elected. |
|
| California 51 | D+22 | Juan Vargas | Democratic | 2012 | Incumbent re-elected. |
|
| California 52 | D+6 | Scott Peters | Democratic | 2012 | Incumbent re-elected. |
|
| California 53 | D+14 | Susan Davis | Democratic | 2000 | Incumbent re-elected. |
|
Colorado※
The state congressional delegation flipped from a 4–3 Republican majority to a 4–3 Democratic majority.
| District | Incumbent | Results | Candidates | |||
|---|---|---|---|---|---|---|
| Location | 2017 PVI |
Representative | Party | First elected | ||
| Colorado 1 | D+21 | Diana DeGette | Democratic | 1996 | Incumbent re-elected. |
|
| Colorado 2 | D+9 | Jared Polis | Democratic | 2008 | Incumbent retired to run for Governor of Colorado. New member elected. Democratic hold. |
|
| Colorado 3 | R+6 | Scott Tipton | Republican | 2010 | Incumbent re-elected. |
|
| Colorado 4 | R+13 | Ken Buck | Republican | 2014 | Incumbent re-elected. |
|
| Colorado 5 | R+14 | Doug Lamborn | Republican | 2006 | Incumbent re-elected. |
|
| Colorado 6 | D+2 | Mike Coffman | Republican | 2008 | Incumbent lost re-election. New member elected. Democratic gain. |
|
| Colorado 7 | D+6 | Ed Perlmutter | Democratic | 2006 | Incumbent re-elected. |
|
Connecticut※
The state congressional delegation remained unchanged at 5–0 Democrats.
| District | Incumbent | Results | Candidates | |||
|---|---|---|---|---|---|---|
| Location | 2017 PVI |
Representative | Party | First elected | ||
| Connecticut 1 | D+12 | John B. Larson | Democratic | 1998 | Incumbent re-elected. |
|
| Connecticut 2 | D+3 | Joe Courtney | Democratic | 2006 | Incumbent re-elected. |
|
| Connecticut 3 | D+9 | Rosa DeLauro | Democratic | 1990 | Incumbent re-elected. |
|
| Connecticut 4 | D+7 | Jim Himes | Democratic | 2008 | Incumbent re-elected. |
|
| Connecticut 5 | D+2 | Elizabeth Esty | Democratic | 2012 | Incumbent retired. New member elected. Democratic hold. |
|
Delaware※
Democrats retained control of the sole seat in the state.
| District | Incumbent | Results | Candidates | |||
|---|---|---|---|---|---|---|
| Location | 2017 PVI |
Representative | Party | First elected | ||
| Delaware at-large | D+6 | Lisa Blunt Rochester | Democratic | 2016 | Incumbent re-elected. |
|
Florida※
The Republican majority was reduced from 16–11 to 14–13.
| District | Incumbent | Results | Candidates | |||
|---|---|---|---|---|---|---|
| Location | 2017 PVI |
Representative | Party | First elected | ||
| Florida 1 | R+22 | Matt Gaetz | Republican | 2016 | Incumbent re-elected. |
|
| Florida 2 | R+18 | Neal Dunn | Republican | 2016 | Incumbent re-elected. |
|
| Florida 3 | R+9 | Ted Yoho | Republican | 2012 | Incumbent re-elected. |
|
| Florida 4 | R+17 | John Rutherford | Republican | 2016 | Incumbent re-elected. |
|
| Florida 5 | D+12 | Al Lawson | Democratic | 2016 | Incumbent re-elected. |
|
| Florida 6 | R+7 | Vacant | Rep. Ron DeSantis (R) resigned September 10, 2018, to run for Governor of Florida. New member elected. Republican hold. |
| ||
| Florida 7 | Even | Stephanie Murphy | Democratic | 2016 | Incumbent re-elected. |
|
| Florida 8 | R+11 | Bill Posey | Republican | 2008 | Incumbent re-elected. |
|
| Florida 9 | D+5 | Darren Soto | Democratic | 2016 | Incumbent re-elected. |
|
| Florida 10 | D+11 | Val Demings | Democratic | 2016 | Incumbent re-elected. |
|
| Florida 11 | R+15 | Daniel Webster | Republican | 2010 | Incumbent re-elected. |
|
| Florida 12 | R+8 | Gus Bilirakis | Republican | 2006 | Incumbent re-elected. |
|
| Florida 13 | D+2 | Charlie Crist | Democratic | 2016 | Incumbent re-elected. |
|
| Florida 14 | D+7 | Kathy Castor | Democratic | 2006 | Incumbent re-elected. |
|
| Florida 15 | R+6 | Dennis Ross | Republican | 2010 | Incumbent retired. New member elected. Republican hold. |
|
| Florida 16 | R+7 | Vern Buchanan | Republican | 2006 | Incumbent re-elected. |
|
| Florida 17 | R+13 | Tom Rooney | Republican | 2008 | Incumbent retired. New member elected. Republican hold. |
|
| Florida 18 | R+5 | Brian Mast | Republican | 2016 | Incumbent re-elected. |
|
| Florida 19 | R+13 | Francis Rooney | Republican | 2016 | Incumbent re-elected. |
|
| Florida 20 | D+31 | Alcee Hastings | Democratic | 1992 | Incumbent re-elected. |
|
| Florida 21 | D+9 | Lois Frankel | Democratic | 2012 | Incumbent re-elected. |
|
| Florida 22 | D+6 | Ted Deutch | Democratic | 2010 (special) | Incumbent re-elected. |
|
| Florida 23 | D+11 | Debbie Wasserman Schultz | Democratic | 2004 | Incumbent re-elected. |
|
| Florida 24 | D+34 | Frederica Wilson | Democratic | 2010 | Incumbent re-elected. |
|
| Florida 25 | R+4 | Mario Díaz-Balart | Republican | 2002 | Incumbent re-elected. |
|
| Florida 26 | D+6 | Carlos Curbelo | Republican | 2014 | Incumbent lost re-election. New member elected. Democratic gain. |
|
| Florida 27 | D+5 | Ileana Ros-Lehtinen | Republican | 1989 | Incumbent retired. New member elected. Democratic gain. |
|
Georgia※
The Republican majority was reduced from 10–4 to 9–5.
| District | Incumbent | Results | Candidates | |||
|---|---|---|---|---|---|---|
| Location | 2017 PVI |
Representative | Party | First elected | ||
| Georgia 1 | R+9 | Buddy Carter | Republican | 2014 | Incumbent re-elected. |
|
| Georgia 2 | D+6 | Sanford Bishop | Democratic | 1992 | Incumbent re-elected. |
|
| Georgia 3 | R+18 | Drew Ferguson | Republican | 2016 | Incumbent re-elected. |
|
| Georgia 4 | D+24 | Hank Johnson | Democratic | 2006 | Incumbent re-elected. |
|
| Georgia 5 | D+34 | John Lewis | Democratic | 1986 | Incumbent re-elected. |
|
| Georgia 6 | R+8 | Karen Handel | Republican | 2017 (special) | Incumbent lost re-election. New member elected. Democratic gain. |
|
| Georgia 7 | R+9 | Rob Woodall | Republican | 2010 | Incumbent re-elected. |
|
| Georgia 8 | R+15 | Austin Scott | Republican | 2010 | Incumbent re-elected. |
|
| Georgia 9 | R+31 | Doug Collins | Republican | 2012 | Incumbent re-elected. |
|
| Georgia 10 | R+15 | Jody Hice | Republican | 2014 | Incumbent re-elected. |
|
| Georgia 11 | R+17 | Barry Loudermilk | Republican | 2014 | Incumbent re-elected. |
|
| Georgia 12 | R+9 | Rick Allen | Republican | 2014 | Incumbent re-elected. |
|
| Georgia 13 | D+20 | David Scott | Democratic | 2002 | Incumbent re-elected. |
|
| Georgia 14 | R+27 | Tom Graves | Republican | 2010 (special) | Incumbent re-elected. |
|
Hawaii※
Hawaii maintained its 2-0 Democratic hold.
| District | Incumbent | Results | Candidates | |||
|---|---|---|---|---|---|---|
| Location | 2017 PVI |
Representative | Party | First elected | ||
| Hawaii 1 | D+17 | Colleen Hanabusa | Democratic | 2010 2014 (retired) 2016 |
Incumbent retired to run for Governor of Hawaii. New member elected. Democratic hold. |
|
| Hawaii 2 | D+19 | Tulsi Gabbard | Democratic | 2012 | Incumbent re-elected. |
|
Idaho※
Idaho maintained its 2-0 Republican hold.
| District | Incumbent | Results | Candidates | |||
|---|---|---|---|---|---|---|
| Location | 2017 PVI |
Representative | Party | First elected | ||
| Idaho 1 | R+21 | Raúl Labrador | Republican | 2010 | Incumbent retired to run for Governor of Idaho. New member elected. Republican hold. |
|
| Idaho 2 | R+17 | Mike Simpson | Republican | 1998 | Incumbent re-elected. |
|
Illinois※
The Democratic majority increased from 11–7 to 13–5.
| District | Incumbent | Results | Candidates | |||
|---|---|---|---|---|---|---|
| Location | 2017 PVI |
Representative | Party | First elected | ||
| Illinois 1 | D+27 | Bobby Rush | Democratic | 1992 | Incumbent re-elected. |
|
| Illinois 2 | D+29 | Robin Kelly | Democratic | 2013 (special) | Incumbent re-elected. |
|
| Illinois 3 | D+6 | Dan Lipinski | Democratic | 2004 | Incumbent re-elected. |
|
| Illinois 4 | D+33 | Luis Gutiérrez | Democratic | 1992 | Incumbent retired. New member elected. Democratic hold. |
|
| Illinois 5 | D+20 | Mike Quigley | Democratic | 2009 (special) | Incumbent re-elected. |
|
| Illinois 6 | R+2 | Peter Roskam | Republican | 2006 | Incumbent lost re-election. New member elected. Democratic gain. |
|
| Illinois 7 | D+38 | Danny Davis | Democratic | 1996 | Incumbent re-elected. |
|
| Illinois 8 | D+8 | Raja Krishnamoorthi | Democratic | 2016 | Incumbent re-elected. |
|
| Illinois 9 | D+18 | Jan Schakowsky | Democratic | 1998 | Incumbent re-elected. |
|
| Illinois 10 | D+10 | Brad Schneider | Democratic | 2012 2014 (defeated) 2016 |
Incumbent re-elected. |
|
| Illinois 11 | D+9 | Bill Foster | Democratic | 2008 (special) 2010 (defeated) 2012 |
Incumbent re-elected. |
|
| Illinois 12 | R+5 | Mike Bost | Republican | 2014 | Incumbent re-elected. |
|
| Illinois 13 | R+3 | Rodney Davis | Republican | 2012 | Incumbent re-elected. |
|
| Illinois 14 | R+5 | Randy Hultgren | Republican | 2010 | Incumbent lost re-election. New member elected. Democratic gain. |
|
| Illinois 15 | R+21 | John Shimkus | Republican | 1996 | Incumbent re-elected. |
|
| Illinois 16 | R+8 | Adam Kinzinger | Republican | 2010 | Incumbent re-elected. |
|
| Illinois 17 | D+3 | Cheri Bustos | Democratic | 2012 | Incumbent re-elected. |
|
| Illinois 18 | R+15 | Darin LaHood | Republican | 2015 (special) | Incumbent re-elected. |
|
Indiana※
The Republican majority remained at 7–2.
| District | Incumbent | Results | Candidates | |||
|---|---|---|---|---|---|---|
| Location | 2017 PVI |
Representative | Party | First elected | ||
| Indiana 1 | D+8 | Pete Visclosky | Democratic | 1984 | Incumbent re-elected. |
|
| Indiana 2 | R+11 | Jackie Walorski | Republican | 2012 | Incumbent re-elected. |
|
| Indiana 3 | R+18 | Jim Banks | Republican | 2016 | Incumbent re-elected. |
|
| Indiana 4 | R+17 | Todd Rokita | Republican | 2010 | Incumbent retired to run for U.S. Senator. New member elected. Republican hold. |
|
| Indiana 5 | R+9 | Susan Brooks | Republican | 2012 | Incumbent re-elected. |
|
| Indiana 6 | R+18 | Luke Messer | Republican | 2012 | Incumbent retired to run for U.S. Senator. New member elected. Republican hold. |
|
| Indiana 7 | D+11 | André Carson | Democratic | 2008 (special) | Incumbent re-elected. |
|
| Indiana 8 | R+15 | Larry Bucshon | Republican | 2010 | Incumbent re-elected. |
|
| Indiana 9 | R+13 | Trey Hollingsworth | Republican | 2016 | Incumbent re-elected. |
|
Iowa※
Iowa's delegation flipped from a 3–1 Republican majority to a 3–1 Democratic majority.
| District | Incumbent | Results | Candidates | |||
|---|---|---|---|---|---|---|
| Location | 2017 PVI |
Representative | Party | First elected | ||
| Iowa 1 | D+1 | Rod Blum | Republican | 2014 | Incumbent lost re-election. New member elected. Democratic gain. |
|
| Iowa 2 | D+1 | Dave Loebsack | Democratic | 2006 | Incumbent re-elected. |
|
| Iowa 3 | R+1 | David Young | Republican | 2014 | Incumbent lost re-election. New member elected. Democratic gain. |
Others
|
| Iowa 4 | R+11 | Steve King | Republican | 2002 | Incumbent re-elected. |
|
Kansas※
The Republican majority slipped from 4–0 to 3–1.
| District | Incumbent | Results | Candidates | |||
|---|---|---|---|---|---|---|
| Location | 2017 PVI |
Representative | Party | First elected | ||
| Kansas 1 | R+24 | Roger Marshall | Republican | 2016 | Incumbent re-elected. |
|
| Kansas 2 | R+10 | Lynn Jenkins | Republican | 2008 | Incumbent retired. New member elected. Republican hold. |
|
| Kansas 3 | R+4 | Kevin Yoder | Republican | 2010 | Incumbent lost re-election. New member elected. Democratic gain. |
|
| Kansas 4 | R+15 | Ron Estes | Republican | 2017 (special) | Incumbent re-elected. |
|
Kentucky※
Republicans maintained their 5–1 majority.
| District | Incumbent | Results | Candidates | |||
|---|---|---|---|---|---|---|
| Location | 2017 PVI |
Representative | Party | First elected | ||
| Kentucky 1 | R+23 | James Comer | Republican | 2016 | Incumbent re-elected. |
|
| Kentucky 2 | R+19 | Brett Guthrie | Republican | 2008 | Incumbent re-elected. |
|
| Kentucky 3 | D+6 | John Yarmuth | Democratic | 2006 | Incumbent re-elected. |
|
| Kentucky 4 | R+18 | Thomas Massie | Republican | 2012 | Incumbent re-elected. |
|
| Kentucky 5 | R+31 | Hal Rogers | Republican | 1980 | Incumbent re-elected. |
|
| Kentucky 6 | R+9 | Andy Barr | Republican | 2012 | Incumbent re-elected. |
Others
|
Louisiana※
All incumbents were re-elected, and Republicans maintained their 5–1 majority.
| District | Incumbent | Results | Candidates | |||
|---|---|---|---|---|---|---|
| Location | 2017 PVI |
Representative | Party | First elected | ||
| Louisiana 1 | R+24 | Steve Scalise | Republican | 2008 (special) | Incumbent re-elected. |
|
| Louisiana 2 | D+25 | Cedric Richmond | Democratic | 2010 | Incumbent re-elected. |
|
| Louisiana 3 | R+20 | Clay Higgins | Republican | 2016 | Incumbent re-elected. |
|
| Louisiana 4 | R+13 | Mike Johnson | Republican | 2016 | Incumbent re-elected. |
|
| Louisiana 5 | R+15 | Ralph Abraham | Republican | 2014 | Incumbent re-elected. |
|
| Louisiana 6 | R+19 | Garret Graves | Republican | 2014 | Incumbent re-elected. |
|
Maine※
The 1–1 tie became a 2–0 Democratic hold. This was the first use of ranked choice voting to decide a House race.
| District | Incumbent | Results | Candidates | |||
|---|---|---|---|---|---|---|
| Location | 2017 PVI |
Representative | Party | First elected | ||
| Maine 1 | D+8 | Chellie Pingree | Democratic | 2008 | Incumbent re-elected. |
|
| Maine 2 | R+2 | Bruce Poliquin | Republican | 2014 | Incumbent lost re-election. New member elected. Democratic gain. |
|
Maryland※
Democrats maintained their 7–1 majority.
| District | Incumbent | Results | Candidates | |||
|---|---|---|---|---|---|---|
| Location | 2017 PVI |
Representative | Party | First elected | ||
| Maryland 1 | R+14 | Andy Harris | Republican | 2010 | Incumbent re-elected. |
|
| Maryland 2 | D+11 | Dutch Ruppersberger | Democratic | 2002 | Incumbent re-elected. |
|
| Maryland 3 | D+13 | John Sarbanes | Democratic | 2006 | Incumbent re-elected. |
|
| Maryland 4 | D+28 | Anthony Brown | Democratic | 2016 | Incumbent re-elected. |
|
| Maryland 5 | D+16 | Steny Hoyer | Democratic | 1981 (special) | Incumbent re-elected. |
|
| Maryland 6 | D+6 | John Delaney | Democratic | 2012 | Incumbent retired to run for U.S. President. New member elected. Democratic hold. |
|
| Maryland 7 | D+26 | Elijah Cummings | Democratic | 1996 | Incumbent re-elected. |
|
| Maryland 8 | D+14 | Jamie Raskin | Democratic | 2016 | Incumbent re-elected. |
|
Massachusetts※
Democrats maintained their 9–0 hold.
| District | Incumbent | Results | Candidates | |||
|---|---|---|---|---|---|---|
| Location | 2017 PVI |
Representative | Party | First elected | ||
| Massachusetts 1 | D+12 | Richard Neal | Democratic | 1988 | Incumbent re-elected. |
|
| Massachusetts 2 | D+9 | Jim McGovern | Democratic | 1996 | Incumbent re-elected. |
|
| Massachusetts 3 | D+9 | Niki Tsongas | Democratic | 2007 (special) | Incumbent retired. New member elected. Democratic hold. |
|
| Massachusetts 4 | D+9 | Joe Kennedy III | Democratic | 2012 | Incumbent re-elected. |
|
| Massachusetts 5 | D+18 | Katherine Clark | Democratic | 2013 (special) | Incumbent re-elected. |
|
| Massachusetts 6 | D+6 | Seth Moulton | Democratic | 2014 | Incumbent re-elected. |
|
| Massachusetts 7 | D+34 | Mike Capuano | Democratic | 1998 | Incumbent lost renomination. New member elected. Democratic hold. |
|
| Massachusetts 8 | D+10 | Stephen Lynch | Democratic | 2001 (special) | Incumbent re-elected. |
|
| Massachusetts 9 | D+4 | Bill Keating | Democratic | 2010 | Incumbent re-elected. |
|
Michigan※
The delegation flipped from a 9–5 Republican majority to a 7–7 split.
| District | Incumbent | Results | Candidates | |||
|---|---|---|---|---|---|---|
| Location | 2017 PVI |
Representative | Party | First elected | ||
| Michigan 1 | R+9 | Jack Bergman | Republican | 2016 | Incumbent re-elected. |
|
| Michigan 2 | R+9 | Bill Huizenga | Republican | 2010 | Incumbent re-elected. |
|
| Michigan 3 | R+6 | Justin Amash | Republican | 2010 | Incumbent re-elected. |
|
| Michigan 4 | R+10 | John Moolenaar | Republican | 2014 | Incumbent re-elected. |
|
| Michigan 5 | D+5 | Dan Kildee | Democratic | 2012 | Incumbent re-elected. |
|
| Michigan 6 | R+4 | Fred Upton | Republican | 1986 | Incumbent re-elected. |
|
| Michigan 7 | R+7 | Tim Walberg | Republican | 2006 2008 (defeated) 2010 |
Incumbent re-elected. |
|
| Michigan 8 | R+4 | Mike Bishop | Republican | 2014 | Incumbent lost re-election. New member elected. Democratic gain. |
|
| Michigan 9 | D+4 | Sander Levin | Democratic | 1982 | Incumbent retired. New member elected. Democratic hold. |
|
| Michigan 10 | R+13 | Paul Mitchell | Republican | 2016 | Incumbent re-elected. |
|
| Michigan 11 | R+4 | David Trott | Republican | 2014 | Incumbent retired. New member elected. Democratic gain. |
|
| Michigan 12 | D+14 | Debbie Dingell | Democratic | 2014 | Incumbent re-elected. |
|
| Michigan 13 | D+32 | Vacant | Rep. John Conyers Jr. (D) resigned December 5, 2017. New member elected. Democratic hold. A different Democratic candidate was elected the same day to finish the current term. |
| ||
| Michigan 14 | D+30 | Brenda Lawrence | Democratic | 2014 | Incumbent re-elected. |
|
Minnesota※
Although half of the seats switched parties, Democrats maintained the same 5–3 majority.
| District | Incumbent | Results | Candidates | |||
|---|---|---|---|---|---|---|
| Location | 2017 PVI |
Representative | Party | First elected | ||
| Minnesota 1 | R+5 | Tim Walz | DFL | 2006 | Incumbent retired to run for Governor of Minnesota. New member elected. Republican gain. |
|
| Minnesota 2 | R+2 | Jason Lewis | Republican | 2016 | Incumbent lost re-election. New member elected. DFL gain. |
|
| Minnesota 3 | D+1 | Erik Paulsen | Republican | 2008 | Incumbent lost re-election. New member elected. DFL gain. |
|
| Minnesota 4 | D+14 | Betty McCollum | DFL | 2000 | Incumbent re-elected. |
|
| Minnesota 5 | D+26 | Keith Ellison | DFL | 2006 | Incumbent retired to run for Minnesota Attorney General. New member elected. DFL hold. |
|
| Minnesota 6 | R+12 | Tom Emmer | Republican | 2014 | Incumbent re-elected. |
|
| Minnesota 7 | R+12 | Collin Peterson | DFL | 1990 | Incumbent re-elected. |
|
| Minnesota 8 | R+4 | Rick Nolan | DFL | 1974 1980 (retired) 2012 |
Incumbent retired. New member elected. Republican gain. |
|
Mississippi※
The Republicans maintained their 3–1 majority in the state.
| District | Incumbent | Results | Candidates | |||
|---|---|---|---|---|---|---|
| Location | 2017 PVI |
Representative | Party | First elected | ||
| Mississippi 1 | R+16 | Trent Kelly | Republican | 2015 (special) | Incumbent re-elected. |
|
| Mississippi 2 | D+14 | Bennie Thompson | Democratic | 1992 | Incumbent re-elected. |
|
| Mississippi 3 | R+13 | Gregg Harper | Republican | 2008 | Incumbent retired. New member elected. Republican hold. |
|
| Mississippi 4 | R+21 | Steven Palazzo | Republican | 2010 | Incumbent re-elected. |
|
Missouri※
The Republicans maintained their 6-2 seat majority.
| District | Incumbent | Results | Candidates | |||
|---|---|---|---|---|---|---|
| Location | 2017 PVI |
Representative | Party | First elected | ||
| Missouri 1 | D+29 | Lacy Clay | Democratic | 2000 | Incumbent re-elected. |
|
| Missouri 2 | R+8 | Ann Wagner | Republican | 2012 | Incumbent re-elected. |
|
| Missouri 3 | R+18 | Blaine Luetkemeyer | Republican | 2008 | Incumbent re-elected. |
|
| Missouri 4 | R+17 | Vicky Hartzler | Republican | 2010 | Incumbent re-elected. |
|
| Missouri 5 | D+7 | Emanuel Cleaver | Democratic | 2004 | Incumbent re-elected. |
|
| Missouri 6 | R+16 | Sam Graves | Republican | 2000 | Incumbent re-elected. |
|
| Missouri 7 | R+23 | Billy Long | Republican | 2010 | Incumbent re-elected. |
|
| Missouri 8 | R+24 | Jason Smith | Republican | 2013 (special) | Incumbent re-elected. |
|
Montana※
Republicans maintained control of the lone house seat.
| District | Incumbent | Results | Candidates | |||
|---|---|---|---|---|---|---|
| Location | 2017 PVI |
Representative | Party | First elected | ||
| Montana at-large | R+11 | Greg Gianforte | Republican | 2017 (special) | Incumbent re-elected. |
|
Nebraska※
Republicans maintained their 3–0 majority.
| District | Incumbent | Results | Candidates | |||
|---|---|---|---|---|---|---|
| Location | 2017 PVI |
Representative | Party | First elected | ||
| Nebraska 1 | R+11 | Jeff Fortenberry | Republican | 2004 | Incumbent re-elected. |
|
| Nebraska 2 | R+4 | Don Bacon | Republican | 2016 | Incumbent re-elected. |
|
| Nebraska 3 | R+27 | Adrian Smith | Republican | 2006 | Incumbent re-elected. |
|
Nevada※
Democrats maintained their 3–1 majority.
| District | Incumbent | Results | Candidates | |||
|---|---|---|---|---|---|---|
| Location | 2017 PVI |
Representative | Party | First elected | ||
| Nevada 1 | D+15 | Dina Titus | Democratic | 2008 2010 (defeated) 2012 |
Incumbent re-elected. |
|
| Nevada 2 | R+7 | Mark Amodei | Republican | 2011 (special) | Incumbent re-elected. |
|
| Nevada 3 | R+2 | Jacky Rosen | Democratic | 2016 | Incumbent retired to run for U.S. Senator. New member elected. Democratic hold. |
Others
|
| Nevada 4 | D+3 | Ruben Kihuen | Democratic | 2016 | Incumbent retired. New member elected. Democratic hold. |
Others
|
New Hampshire※
The Democrats maintained control of both house seats.
| District | Incumbent | Results | Candidates | |||
|---|---|---|---|---|---|---|
| Location | 2017 PVI |
Representative | Party | First elected | ||
| New Hampshire 1 | R+2 | Carol Shea-Porter | Democratic | 2006 2010 (defeated) 2012 2014 (defeated) 2016 |
Incumbent retired. New member elected. Democratic hold. |
|
| New Hampshire 2 | D+2 | Annie Kuster | Democratic | 2012 | Incumbent re-elected. |
|
New Jersey※
The state congressional delegation changed from 7–5 for Democrats to 11–1 for Democrats.
| District | Incumbent | Results | Candidates | |||
|---|---|---|---|---|---|---|
| Location | 2017 PVI |
Representative | Party | First elected | ||
| New Jersey 1 | D+13 | Donald Norcross | Democratic | 2014 | Incumbent re-elected. |
Others
|
| New Jersey 2 | R+1 | Frank LoBiondo | Republican | 1994 | Incumbent retired. New member elected. Democratic gain. |
Others
|
| New Jersey 3 | R+2 | Tom MacArthur | Republican | 2014 | Incumbent lost re-election. New member elected. Democratic gain. |
|
| New Jersey 4 | R+8 | Chris Smith | Republican | 1980 | Incumbent re-elected. |
Others
|
| New Jersey 5 | R+3 | Josh Gottheimer | Democratic | 2016 | Incumbent re-elected. |
Others
|
| New Jersey 6 | D+9 | Frank Pallone | Democratic | 1988 | Incumbent re-elected. |
|
| New Jersey 7 | R+3 | Leonard Lance | Republican | 2008 | Incumbent lost re-election. New member elected. Democratic gain. |
|
| New Jersey 8 | D+27 | Albio Sires | Democratic | 2006 | Incumbent re-elected. |
|
| New Jersey 9 | D+16 | Bill Pascrell | Democratic | 1996 | Incumbent re-elected. |
|
| New Jersey 10 | D+36 | Donald Payne Jr. | Democratic | 2012 (Special) | Incumbent re-elected. |
|
| New Jersey 11 | R+3 | Rodney Frelinghuysen | Republican | 1994 | Incumbent retired. New member elected. Democratic gain. |
|
| New Jersey 12 | D+16 | Bonnie Watson Coleman | Democratic | 2014 | Incumbent re-elected. |
|
New Mexico※
The state congressional delegation changed from 2–1 for Democrats to all 3 seats controlled by Democrats.
| District | Incumbent | Results | Candidates | |||
|---|---|---|---|---|---|---|
| Location | 2017 PVI |
Representative | Party | First elected | ||
| New Mexico 1 | D+7 | Michelle Luján Grisham | Democratic | 2012 | Incumbent retired to run for Governor of New Mexico. New member elected. Democratic hold. |
|
| New Mexico 2 | R+6 | Steve Pearce | Republican | 2002 2008 (retired) 2010 |
Incumbent retired to run for Governor of New Mexico. New member elected. Democratic gain. |
|
| New Mexico 3 | D+8 | Ben Ray Luján | Democratic | 2008 | Incumbent re-elected. |
|
New York※
Democrats increased their seat majority in New York's congressional delegation from 18–9 to 21–6.
| District | Incumbent | Results | Candidates | |||
|---|---|---|---|---|---|---|
| Location | 2017 PVI |
Representative | Party | First elected | ||
| New York 1 | R+5 | Lee Zeldin | Republican | 2014 | Incumbent re-elected. |
|
| New York 2 | R+3 | Peter King | Republican | 1992 | Incumbent re-elected. |
|
| New York 3 | D+1 | Thomas Suozzi | Democratic | 2016 | Incumbent re-elected. |
|
| New York 4 | D+4 | Kathleen Rice | Democratic | 2014 | Incumbent re-elected. |
|
| New York 5 | D+37 | Gregory Meeks | Democratic | 1998 | Incumbent re-elected. |
|
| New York 6 | D+16 | Grace Meng | Democratic | 2012 | Incumbent re-elected. |
|
| New York 7 | D+38 | Nydia Velázquez | Democratic | 1992 | Incumbent re-elected. |
|
| New York 8 | D+36 | Hakeem Jeffries | Democratic | 2012 | Incumbent re-elected. |
|
| New York 9 | D+34 | Yvette Clarke | Democratic | 2006 | Incumbent re-elected. |
|
| New York 10 | D+26 | Jerry Nadler | Democratic | 1992 | Incumbent re-elected. |
|
| New York 11 | R+3 | Dan Donovan | Republican | 2015 (special) | Incumbent lost re-election. New member elected. Democratic gain. |
|
| New York 12 | D+31 | Carolyn Maloney | Democratic | 1992 | Incumbent re-elected. |
|
| New York 13 | D+43 | Adriano Espaillat | Democratic | 2016 | Incumbent re-elected. |
|
| New York 14 | D+29 | Joe Crowley | Democratic | 1998 | Incumbent lost renomination. But remained on ballot. New member elected. Democratic hold. |
|
| New York 15 | D+44 | José E. Serrano | Democratic | 1990 | Incumbent re-elected. |
|
| New York 16 | D+24 | Eliot Engel | Democratic | 1988 | Incumbent re-elected. |
|
| New York 17 | D+7 | Nita Lowey | Democratic | 1988 | Incumbent re-elected. |
|
| New York 18 | R+1 | Sean Patrick Maloney | Democratic | 2012 | Incumbent re-elected. |
|
| New York 19 | R+2 | John Faso | Republican | 2016 | Incumbent lost re-election. New member elected. Democratic gain. |
|
| New York 20 | D+7 | Paul Tonko | Democratic | 2008 | Incumbent re-elected. |
|
| New York 21 | R+4 | Elise Stefanik | Republican | 2014 | Incumbent re-elected. |
|
| New York 22 | R+6 | Claudia Tenney | Republican | 2016 | Incumbent lost re-election. New member elected. Democratic gain. |
|
| New York 23 | R+6 | Tom Reed | Republican | 2010 (special) | Incumbent re-elected. |
|
| New York 24 | D+3 | John Katko | Republican | 2014 | Incumbent re-elected. |
|
| New York 25 | D+8 | Vacant | Incumbent Louise Slaughter died March 16, 2018. New member elected. Democratic hold. Winner was also elected to fill unexpired term, see above. |
| ||
| New York 26 | D+11 | Brian Higgins | Democratic | 2004 | Incumbent re-elected. |
|
| New York 27 | R+11 | Chris Collins | Republican | 2012 | Incumbent re-elected. |
|
North Carolina※
Due to allegations of electoral fraud, the 116th Congress was sworn in with one seat vacant. On February 21, 2019, a new election was ordered by the state election board.
| District | Incumbent | Results | Candidates | |||
|---|---|---|---|---|---|---|
| Location | 2017 PVI |
Representative | Party | First elected | ||
| North Carolina 1 | D+17 | G. K. Butterfield | Democratic | 2004 (special) | Incumbent re-elected. |
|
| North Carolina 2 | R+7 | George Holding | Republican | 2012 | Incumbent re-elected. |
|
| North Carolina 3 | R+12 | Walter B. Jones Jr. | Republican | 1994 | Incumbent re-elected. |
|
| North Carolina 4 | D+17 | David Price | Democratic | 1986 1994 (defeated) 1996 |
Incumbent re-elected. |
|
| North Carolina 5 | R+10 | Virginia Foxx | Republican | 2004 | Incumbent re-elected. |
|
| North Carolina 6 | R+9 | Mark Walker | Republican | 2014 | Incumbent re-elected. |
|
| North Carolina 7 | R+9 | David Rouzer | Republican | 2014 | Incumbent re-elected. |
|
| North Carolina 8 | R+8 | Richard Hudson | Republican | 2012 | Incumbent re-elected. |
|
| North Carolina 9 | R+8 | Robert Pittenger | Republican | 2012 | Incumbent lost renomination. Results void and new election ordered. Republican loss. |
|
| North Carolina 10 | R+12 | Patrick McHenry | Republican | 2004 | Incumbent re-elected. |
|
| North Carolina 11 | R+14 | Mark Meadows | Republican | 2012 | Incumbent re-elected. |
|
| North Carolina 12 | D+18 | Alma Adams | Democratic | 2014 | Incumbent re-elected. |
|
| North Carolina 13 | R+6 | Ted Budd | Republican | 2016 | Incumbent re-elected. |
|
North Dakota※
Republicans maintained control of the sole house seat.
| District | Incumbent | Results | Candidates | |||
|---|---|---|---|---|---|---|
| Location | 2017 PVI |
Representative | Party | First elected | ||
| North Dakota at-large | R+16 | Kevin Cramer | Republican | 2012 | Incumbent retired to run for U.S. Senator. New member elected. Republican hold. |
|
Ohio※
The state congressional delegation remained the same at 12–4 for Republicans.
| District | Incumbent | Results | Candidates | |||
|---|---|---|---|---|---|---|
| Location | 2017 PVI |
Representative | Party | First elected | ||
| Ohio 1 | R+5 | Steve Chabot | Republican | 1994 2008 (defeated) 2010 |
Incumbent re-elected. |
|
| Ohio 2 | R+9 | Brad Wenstrup | Republican | 2012 | Incumbent re-elected. |
|
| Ohio 3 | D+19 | Joyce Beatty | Democratic | 2012 | Incumbent re-elected. |
|
| Ohio 4 | R+14 | Jim Jordan | Republican | 2006 | Incumbent re-elected. |
|
| Ohio 5 | R+11 | Bob Latta | Republican | 2006 | Incumbent re-elected. |
|
| Ohio 6 | R+16 | Bill Johnson | Republican | 2010 | Incumbent re-elected. |
|
| Ohio 7 | R+12 | Bob Gibbs | Republican | 2010 | Incumbent re-elected. |
|
| Ohio 8 | R+17 | Warren Davidson | Republican | 2016 (special) | Incumbent re-elected. |
|
| Ohio 9 | D+14 | Marcy Kaptur | Democratic | 1982 | Incumbent re-elected. |
|
| Ohio 10 | R+4 | Mike Turner | Republican | 2002 | Incumbent re-elected. |
|
| Ohio 11 | D+32 | Marcia Fudge | Democratic | 2006 | Incumbent re-elected. |
|
| Ohio 12 | R+7 | Troy Balderson | Republican | 2018 (special) | Incumbent re-elected. |
|
| Ohio 13 | D+7 | Tim Ryan | Democratic | 2002 | Incumbent re-elected. |
|
| Ohio 14 | R+5 | David Joyce | Republican | 2012 | Incumbent re-elected. |
|
| Ohio 15 | R+7 | Steve Stivers | Republican | 2010 | Incumbent re-elected. |
|
| Ohio 16 | R+8 | Jim Renacci | Republican | 2010 | Incumbent retired to run for U.S. Senator. New member elected. Republican hold. |
|
Oklahoma※
The state congressional delegation changed from 5–0 for Republicans to a 4–1 Republican majority.
| District | Incumbent | Results | Candidates | |||
|---|---|---|---|---|---|---|
| Location | 2017 PVI |
Representative | Party | First elected | ||
| Oklahoma 1 | R+17 | Vacant | Jim Bridenstine (R) resigned April 23, 2018 to become NASA Administrator. New member elected. Republican hold. |
| ||
| Oklahoma 2 | R+24 | Markwayne Mullin | Republican | 2012 | Incumbent re-elected. |
|
| Oklahoma 3 | R+27 | Frank Lucas | Republican | 1994 | Incumbent re-elected. |
|
| Oklahoma 4 | R+20 | Tom Cole | Republican | 2002 | Incumbent re-elected. |
|
| Oklahoma 5 | R+10 | Steve Russell | Republican | 2014 | Incumbent lost re-election. New member elected. Democratic gain. |
|
Oregon※
The state congressional delegation remained the same, with a 4–1 Democratic majority.
| District | Incumbent | Results | Candidates | |||
|---|---|---|---|---|---|---|
| Location | 2017 PVI |
Representative | Party | First elected | ||
| Oregon 1 | D+9 | Suzanne Bonamici | Democratic | 2012 (special) | Incumbent re-elected. |
|
| Oregon 2 | R+11 | Greg Walden | Republican | 1998 | Incumbent re-elected. |
|
| Oregon 3 | D+24 | Earl Blumenauer | Democratic | 1996 | Incumbent re-elected. |
|
| Oregon 4 | EVEN | Peter DeFazio | Democratic | 1986 | Incumbent re-elected. |
|
| Oregon 5 | EVEN | Kurt Schrader | Democratic | 2008 | Incumbent re-elected. |
|
Pennsylvania※
As a result of changes in the congressional map, the state congressional delegation changed from a 13–5 Republican majority to a 9–9 split.
| District | Incumbent | Results | Candidates | |||
|---|---|---|---|---|---|---|
| Location | 2017 PVI |
Representative | Party | First elected | ||
| Pennsylvania 1 | R+1 | Brian Fitzpatrick Redistricted from the 8th district |
Republican | 2016 | Incumbent re-elected. |
|
| Pennsylvania 2 | D+25 | Brendan Boyle Redistricted from the 13th district |
Democratic | 2014 | Incumbent re-elected. |
|
| Bob Brady Redistricted from the 1st district |
Democratic | 1998 (special) | Incumbent retired. Democratic loss. | |||
| Pennsylvania 3 | D+41 | Dwight Evans Redistricted from the 2nd district |
Democratic | 2016 | Incumbent re-elected. |
|
| Pennsylvania 4 | D+7 | None (New seat) | New seat. New member elected. Democratic gain. |
| ||
| Pennsylvania 5 | D+13 | Vacant | Pat Meehan (R) resigned April 27, 2018, after being redistricted from the 7th district. New member elected. Democratic gain. Winner was also elected to fill unexpired term, see above. |
| ||
| Pennsylvania 6 | D+2 | Ryan Costello | Republican | 2014 | Incumbent retired. New member elected. Democratic gain. |
|
| Pennsylvania 7 | D+1 | Vacant | Charlie Dent (R) resigned May 12, 2018, after being redistricted from the 15th district. New member elected. Democratic gain. Winner was also elected to fill unexpired term, see above. |
| ||
| Pennsylvania 8 | R+1 | Matt Cartwright Redistricted from the 17th district |
Democratic | 2012 | Incumbent re-elected. |
|
| Pennsylvania 9 | R+14 | Lou Barletta Redistricted from the 11th district |
Republican | 2010 | Incumbent retired to run for U.S. Senator. New member elected. Republican hold. |
|
| Pennsylvania 10 | R+6 | Scott Perry Redistricted from the 4th district |
Republican | 2012 | Incumbent re-elected. |
|
| Pennsylvania 11 | R+14 | Lloyd Smucker Redistricted from the 16th district |
Republican | 2016 | Incumbent re-elected. |
|
| Pennsylvania 12 | R+17 | Tom Marino Redistricted from the 10th district |
Republican | 2010 | Incumbent re-elected. |
|
| Pennsylvania 13 | R+22 | Bill Shuster Redistricted from the 9th district |
Republican | 2002 | Incumbent retired. New member elected. Republican hold. |
|
| Pennsylvania 14 | R+14 | None (New seat) | New seat. New member elected. Republican gain. |
| ||
| Pennsylvania 15 | R+20 | Glenn Thompson Redistricted from the 5th district |
Republican | 2008 | Incumbent re-elected. |
|
| Pennsylvania 16 | R+8 | Mike Kelly Redistricted from the 3rd district |
Republican | 2010 | Incumbent re-elected. |
|
| Pennsylvania 17 | R+3 | Conor Lamb Redistricted from the 18th district |
Democratic | 2018 (special) | Incumbent re-elected. |
|
| Keith Rothfus Redistricted from the 12th district |
Republican | 2012 | Incumbent lost re-election. Republican loss. | |||
| Pennsylvania 18 | D+13 | Mike Doyle Redistricted from the 14th district |
Democratic | 1994 | Incumbent re-elected. |
|
Rhode Island※
The state congressional delegation remained unchanged at 2–0 for Democrats.
| District | Incumbent | Results | Candidates | |||
|---|---|---|---|---|---|---|
| Location | 2017 PVI |
Representative | Party | First elected | ||
| Rhode Island 1 | D+16 | David Cicilline | Democratic | 2010 | Incumbent re-elected. |
|
| Rhode Island 2 | D+6 | James Langevin | Democratic | 2000 | Incumbent re-elected. |
|
South Carolina※
The state congressional delegation changed from 6–1 for Republicans to 5–2 for Republicans.
| District | Incumbent | Results | Candidates | |||
|---|---|---|---|---|---|---|
| Location | 2017 PVI |
Representative | Party | First elected | ||
| South Carolina 1 | R+10 | Mark Sanford | Republican | 1994 2000 (retired) 2013 (special) |
Incumbent lost renomination. New member elected. Democratic gain. |
|
| South Carolina 2 | R+12 | Joe Wilson | Republican | 2001 (special) | Incumbent re-elected. |
|
| South Carolina 3 | R+19 | Jeff Duncan | Republican | 2010 | Incumbent re-elected. |
|
| South Carolina 4 | R+15 | Trey Gowdy | Republican | 2010 | Incumbent retired. New member elected. Republican hold. |
|
| South Carolina 5 | R+9 | Ralph Norman | Republican | 2017 (special) | Incumbent re-elected. |
|
| South Carolina 6 | D+19 | Jim Clyburn | Democratic | 1992 | Incumbent re-elected. |
|
| South Carolina 7 | R+9 | Tom Rice | Republican | 2012 | Incumbent re-elected. |
|
South Dakota※
Republicans retained control of the sole seat in the state.
| District | Incumbent | Results | Candidates | |||
|---|---|---|---|---|---|---|
| Location | 2017 PVI |
Representative | Party | First elected | ||
| South Dakota at-large | R+14 | Kristi Noem | Republican | 2010 | Incumbent retired to run for Governor of South Dakota. New member elected. Republican hold. |
|
Tennessee※
Republicans maintained their 7-2 seat majority.
| District | Incumbent | Results | Candidates | |||
|---|---|---|---|---|---|---|
| Location | 2017 PVI |
Representative | Party | First elected | ||
| Tennessee 1 | R+28 | Phil Roe | Republican | 2008 | Incumbent re-elected. |
|
| Tennessee 2 | R+20 | Jimmy Duncan | Republican | 1988 (special) | Incumbent retired. New member elected. Republican hold. |
Others
|
| Tennessee 3 | R+18 | Chuck Fleischmann | Republican | 2010 | Incumbent re-elected. |
|
| Tennessee 4 | R+20 | Scott DesJarlais | Republican | 2010 | Incumbent re-elected. |
|
| Tennessee 5 | D+7 | Jim Cooper | Democratic | 1982 1994 (retired) 2002 |
Incumbent re-elected. |
|
| Tennessee 6 | R+24 | Diane Black | Republican | 2010 | Incumbent retired to run for Governor of Tennessee. New member elected. Republican hold. |
|
| Tennessee 7 | R+20 | Marsha Blackburn | Republican | 2002 | Incumbent retired to run for U.S. Senator. New member elected. Republican hold. |
Others
|
| Tennessee 8 | R+19 | David Kustoff | Republican | 2016 | Incumbent re-elected. |
|
| Tennessee 9 | D+28 | Steve Cohen | Democratic | 2006 | Incumbent re-elected. |
|
Texas※
The state congressional delegation changed from a 25–11 Republican majority to a 23–13 Republican majority.
| District | Incumbent | Results | Candidates | |||
|---|---|---|---|---|---|---|
| Location | 2017 PVI |
Representative | Party | First elected | ||
| Texas 1 | R+25 | Louie Gohmert | Republican | 2004 | Incumbent re-elected. |
|
| Texas 2 | R+11 | Ted Poe | Republican | 2004 | Incumbent retired. New member elected. Republican hold. |
|
| Texas 3 | R+13 | Sam Johnson | Republican | 1991 (special) | Incumbent retired. New member elected. Republican hold. |
|
| Texas 4 | R+28 | John Ratcliffe | Republican | 2014 | Incumbent re-elected. |
|
| Texas 5 | R+16 | Jeb Hensarling | Republican | 2002 | Incumbent retired. New member elected. Republican hold. |
|
| Texas 6 | R+9 | Joe Barton | Republican | 1984 | Incumbent retired. New member elected. Republican hold. |
|
| Texas 7 | R+7 | John Culberson | Republican | 2000 | Incumbent lost re-election. New member elected. Democratic gain. |
|
| Texas 8 | R+28 | Kevin Brady | Republican | 1996 | Incumbent re-elected. |
|
| Texas 9 | D+29 | Al Green | Democratic | 2004 | Incumbent re-elected. |
|
| Texas 10 | R+9 | Michael McCaul | Republican | 2004 | Incumbent re-elected. |
|
| Texas 11 | R+32 | Mike Conaway | Republican | 2004 | Incumbent re-elected. |
|
| Texas 12 | R+18 | Kay Granger | Republican | 1996 | Incumbent re-elected. |
|
| Texas 13 | R+33 | Mac Thornberry | Republican | 1994 | Incumbent re-elected. |
|
| Texas 14 | R+12 | Randy Weber | Republican | 2012 | Incumbent re-elected. |
|
| Texas 15 | D+7 | Vicente Gonzalez | Democratic | 2016 | Incumbent re-elected. |
|
| Texas 16 | D+17 | Beto O'Rourke | Democratic | 2012 | Incumbent retired to run for U.S. Senator. New member elected. Democratic hold. |
|
| Texas 17 | R+12 | Bill Flores | Republican | 2010 | Incumbent re-elected. |
|
| Texas 18 | D+27 | Sheila Jackson Lee | Democratic | 1994 | Incumbent re-elected. |
|
| Texas 19 | R+27 | Jodey Arrington | Republican | 2016 | Incumbent re-elected. |
|
| Texas 20 | D+10 | Joaquin Castro | Democratic | 2012 | Incumbent re-elected. |
|
| Texas 21 | R+10 | Lamar Smith | Republican | 1986 | Incumbent retired. New member elected. Republican hold. |
|
| Texas 22 | R+10 | Pete Olson | Republican | 2008 | Incumbent re-elected. |
|
| Texas 23 | R+1 | Will Hurd | Republican | 2014 | Incumbent re-elected. |
|
| Texas 24 | R+9 | Kenny Marchant | Republican | 2004 | Incumbent re-elected. |
|
| Texas 25 | R+11 | Roger Williams | Republican | 2012 | Incumbent re-elected. |
|
| Texas 26 | R+18 | Michael C. Burgess | Republican | 2002 | Incumbent re-elected. |
|
| Texas 27 | R+13 | Michael Cloud | Republican | 2018 (special) | Incumbent re-elected. |
|
| Texas 28 | D+9 | Henry Cuellar | Democratic | 2004 | Incumbent re-elected. |
|
| Texas 29 | D+19 | Gene Green | Democratic | 1992 | Incumbent retired. New member elected. Democratic hold. |
|
| Texas 30 | D+29 | Eddie Bernice Johnson | Democratic | 1992 | Incumbent re-elected. |
|
| Texas 31 | R+10 | John Carter | Republican | 2002 | Incumbent re-elected. |
|
| Texas 32 | R+5 | Pete Sessions | Republican | 1996 | Incumbent lost re-election. New member elected. Democratic gain. |
|
| Texas 33 | D+23 | Marc Veasey | Democratic | 2012 | Incumbent re-elected. |
|
| Texas 34 | D+10 | Filemon Vela Jr. | Democratic | 2012 | Incumbent re-elected. |
|
| Texas 35 | D+15 | Lloyd Doggett | Democratic | 1994 | Incumbent re-elected. |
|
| Texas 36 | R+26 | Brian Babin | Republican | 2014 | Incumbent re-elected. |
|
Utah※
The state congressional delegation changed from 4–0 for Republicans to a 3–1 Republican majority.
| District | Incumbent | Results | Candidates | |||
|---|---|---|---|---|---|---|
| Location | 2017 PVI |
Representative | Party | First elected | ||
| Utah 1 | R+26 | Rob Bishop | Republican | 2002 | Incumbent re-elected. |
|
| Utah 2 | R+16 | Chris Stewart | Republican | 2012 | Incumbent re-elected. |
|
| Utah 3 | R+25 | John Curtis | Republican | 2017 (special) | Incumbent re-elected. |
|
| Utah 4 | R+13 | Mia Love | Republican | 2014 | Incumbent lost re-election. New member elected. Democratic gain. |
|
Vermont※
The Democrats maintained control of the sole seat in the state.
| District | Incumbent | Results | Candidates | |||
|---|---|---|---|---|---|---|
| Location | 2017 PVI |
Representative | Party | First elected | ||
| Vermont at-large | D+15 | Peter Welch | Democratic | 2006 | Incumbent re-elected. |
|
Virginia※
The state congressional delegation flipped from a 7–4 Republican majority to a 7–4 Democratic majority.
| District | Incumbent | Results | Candidates | |||
|---|---|---|---|---|---|---|
| Location | 2017 PVI |
Representative | Party | First elected | ||
| Virginia 1 | R+8 | Rob Wittman | Republican | 2007 (special) | Incumbent re-elected. |
|
| Virginia 2 | R+3 | Scott Taylor | Republican | 2016 | Incumbent lost re-election. New member elected. Democratic gain. |
|
| Virginia 3 | D+16 | Bobby Scott | Democratic | 1992 | Incumbent re-elected. |
|
| Virginia 4 | D+10 | Donald McEachin | Democratic | 2016 | Incumbent re-elected. |
|
| Virginia 5 | R+6 | Tom Garrett | Republican | 2016 | Incumbent retired. New member elected. Republican hold. |
|
| Virginia 6 | R+13 | Bob Goodlatte | Republican | 1992 | Incumbent retired. New member elected. Republican hold. |
|
| Virginia 7 | R+6 | Dave Brat | Republican | 2014 | Incumbent lost re-election. New member elected. Democratic gain. |
|
| Virginia 8 | D+21 | Don Beyer | Democratic | 2014 | Incumbent re-elected. |
|
| Virginia 9 | R+19 | Morgan Griffith | Republican | 2010 | Incumbent re-elected. |
|
| Virginia 10 | D+1 | Barbara Comstock | Republican | 2014 | Incumbent lost re-election. New member elected. Democratic gain. |
|
| Virginia 11 | D+15 | Gerry Connolly | Democratic | 2008 | Incumbent re-elected. |
|
Washington※
Democrats increased their seat majority from 6–4 to 7–3.
| District | Incumbent | Results | Candidates | |||
|---|---|---|---|---|---|---|
| Location | 2017 PVI |
Representative | Party | First elected | ||
| Washington 1 | D+6 | Suzan DelBene | Democratic | 2012 | Incumbent re-elected. |
|
| Washington 2 | D+10 | Rick Larsen | Democratic | 2000 | Incumbent re-elected. |
|
| Washington 3 | R+4 | Jaime Herrera Beutler | Republican | 2010 | Incumbent re-elected. |
|
| Washington 4 | R+13 | Dan Newhouse | Republican | 2014 | Incumbent re-elected. |
|
| Washington 5 | R+8 | Cathy McMorris Rodgers | Republican | 2004 | Incumbent re-elected. |
|
| Washington 6 | D+6 | Derek Kilmer | Democratic | 2012 | Incumbent re-elected. |
|
| Washington 7 | D+33 | Pramila Jayapal | Democratic | 2016 | Incumbent re-elected. |
|
| Washington 8 | EVEN | Dave Reichert | Republican | 2004 | Incumbent retired. New member elected. Democratic gain. |
|
| Washington 9 | D+21 | Adam Smith | Democratic | 1996 | Incumbent re-elected. |
|
| Washington 10 | D+5 | Denny Heck | Democratic | 2012 | Incumbent re-elected. |
|
West Virginia※
The state congressional delegation remained the same at 3–0 for Republicans.
| District | Incumbent | Results | Candidates | |||
|---|---|---|---|---|---|---|
| Location | 2017 PVI |
Representative | Party | First elected | ||
| West Virginia 1 | R+19 | David McKinley | Republican | 2010 | Incumbent re-elected. |
|
| West Virginia 2 | R+17 | Alex Mooney | Republican | 2014 | Incumbent re-elected. |
|
| West Virginia 3 | R+23 | Vacant | Evan Jenkins (R) resigned September 30, 2018 to join the West Virginia Supreme Court of Appeals. New member elected. Republican hold. |
| ||
Wisconsin※
Republicans maintained their 5-3 seat majority.
| District | Incumbent | Results | Candidates | |||
|---|---|---|---|---|---|---|
| Location | 2017 PVI |
Representative | Party | First elected | ||
| Wisconsin 1 | R+5 | Paul Ryan | Republican | 1998 | Incumbent retired. New member elected. Republican hold. |
|
| Wisconsin 2 | D+18 | Mark Pocan | Democratic | 2012 | Incumbent re-elected. |
|
| Wisconsin 3 | Even | Ron Kind | Democratic | 1996 | Incumbent re-elected. |
|
| Wisconsin 4 | D+25 | Gwen Moore | Democratic | 2004 | Incumbent re-elected. |
|
| Wisconsin 5 | R+13 | Jim Sensenbrenner | Republican | 1978 | Incumbent re-elected. |
|
| Wisconsin 6 | R+8 | Glenn Grothman | Republican | 2014 | Incumbent re-elected. |
|
| Wisconsin 7 | R+8 | Sean Duffy | Republican | 2010 | Incumbent re-elected. |
|
| Wisconsin 8 | R+7 | Mike Gallagher | Republican | 2016 | Incumbent re-elected. |
|
Wyoming※
Republicans maintained control of the sole seat in the state.
| District | Incumbent | Results | Candidates | |||
|---|---|---|---|---|---|---|
| Location | 2017 PVI |
Representative | Party | First Elected | ||
| Wyoming at-large | R+25 | Liz Cheney | Republican | 2016 | Incumbent re-elected. |
|
Non-voting delegates※
American Samoa※
| District | Incumbent | Results | Candidates | ||
|---|---|---|---|---|---|
| Delegate | Party | First elected | |||
| American Samoa at-large | Amata Coleman Radewagen | Republican | 2014 | Incumbent re-elected. |
|
District of Columbia※
| District | Incumbent | Results | Candidates | ||
|---|---|---|---|---|---|
| Delegate | Party | First elected | |||
| District of Columbia at-large | Eleanor Holmes Norton | Democratic | 1990 | Incumbent re-elected. |
|
Guam※
| District | Incumbent | Results | Candidates | ||
|---|---|---|---|---|---|
| Delegate | Party | First elected | |||
| Guam at-large | Madeleine Bordallo | Democratic | 2002 | Incumbent lost renomination. New member elected. Democratic hold. |
|
Northern Mariana Islands※
The election for a non-voting delegate from the Northern Mariana Islands was postponed until Tuesday, November 13, 2018, due to the impact of Typhoon Yutu.
| District | Incumbent | Results | Candidates | ||
|---|---|---|---|---|---|
| Delegate | Party | First elected | |||
| Northern Mariana Islands at-large | Gregorio Sablan | Independent | 2008 | Incumbent re-elected. |
|
Puerto Rico※
The Resident Commissioner of Puerto Rico is: not up for re-election until 2020. Currently held by Republican Jenniffer González, who was first elected in 2016, the Resident Commissioner is the only member of the United States House of Representatives to serve a four-year term.
United States Virgin Islands※
| District | Incumbent | Results | Candidates | ||
|---|---|---|---|---|---|
| Delegate | Party | First elected | |||
| United States Virgin Islands at-large | Stacey Plaskett | Democratic | 2014 | Incumbent re-elected. |
|
See also※
Notes※
- ^ In addition, five of the six non-voting delegates in the U.S. House of Representatives were elected.
- ^ Results from North Carolina's 9th congressional district were voided, leading to a September 2019 special election that was retained by the GOP.
- ^ This figure represents the difference between the number of Democrats seated when the 116th Congress convened in January 2019 (235) and the number of Democrats seated when the 115th Congress convened in January 2017 (194).
- ^ This figure represents the difference between the number of Republicans seated when the 116th Congress convened in January 2019 (199) and the number of Republicans seated when the 115th Congress convened in January 2017 (241).
- ^ The 116th Congress has one vacancy in the House of Representatives. For further information, see 2018 North Carolina's 9th congressional district election#Refusal of certification.
- ^ Not including the Resident Commissioner of Puerto Rico, who serves a four-year term.
- ^ This seat was the tipping point seat for a Democratic majority.
- ^ All races were decided on the initial primary date, eliminating the need for a runoff.
- ^ Louisiana will hold runoff election(s) on December 8, 2018, for any race in which no one candidate wins a majority of the vote in the November jungle primary.
- ^ Galvin won the Democratic nomination as an "Undeclared" candidate. She would be listed on the ballot as "Undeclared" and the nominee of the Democratic Party.
- ^ On September 24, 2018, the Democratic nominee in Florida's 17th congressional district, April Freeman, died. On October 1, 2018, Ellison was announced as her replacement on the ballot.
- ^ The Libertarian Party does not have ballot access in Ohio or Tennessee. Therefore, Libertarian candidates Johnathan Miller (Ohio's 15th district), Greg Samples (Tennessee's 2nd district), and David Ross (Tennessee's 6th district) appear on their ballots as "Independents."
References※
- ^ "2018g – United States Elections Project". electproject.org. Retrieved December 11, 2018.
- ^ Leamon, Eileen J.; Bucelato, Jason, eds. (December 2017). Federal Elections 2016: Election Results for the U.S. President, the U.S. Senate and the U.S. House of Representatives (PDF). Washington, D.C.: Federal Election Commission.
- ^ Johnson, Cheryl L. (February 28, 2019). "Statistics of the Congressional Election of November 6, 2018". Clerk of the U.S. House of Representatives. Retrieved April 27, 2019.
- ^ "What happens now that Democrats will retake the House". NBC News. November 7, 2018. Retrieved February 27, 2019.
- ^ Fuller, Matt (January 3, 2019). "Nancy Pelosi Elected Speaker Of The House". HuffPost. Retrieved February 27, 2019.
- ^ Fox, Lauren; Walsh, Deirdre; Vazquez, Maegan (April 11, 2018). "House Speaker Paul Ryan won't seek re-election: 'I like to think I've done my part'". CNN. Retrieved February 27, 2019.
- ^ "Kevin McCarthy elected minority leader for next Congress". USA Today. Retrieved February 27, 2019.
- ^ Barabak, Mark Z. (November 28, 2018). "TJ Cox beats Republican Rep. David Valadao to give Democrats gain of 40 House seats, seven in California". Los Angeles Times.
- ^ Montanaro, Domenico (November 14, 2018). "It Was A Big, Blue Wave: Democrats Pick Up Most House Seats In A Generation". NPR. Retrieved November 18, 2018.
- ^ Todd, Chuck; Murray, Mark; Dann, Carrie (November 12, 2018). "Democrats had a good showing on Election Day. It's been even better for them since". NBC News. Retrieved November 14, 2018.
- ^ Baynes, Chris (November 13, 2018). "Midterms: Late results reveal Democrats 'blue wave' as party secures best election performance since 1974". The Independent. Archived from the original on May 1, 2022. Retrieved November 14, 2018.
- ^ Wasserman, Dave; Flinn, Ally. "2018 House Popular Vote Tracker". The Cook Political Report. Archived from the original on January 3, 2019. Retrieved January 2, 2019.
- ^ Price, Greg (November 21, 2018). "Republicans suffered worst House midterm defeat in U.S. history based on popular vote". Newsweek.
- ^ Enten, Harry (December 6, 2018). "Latest House results confirm 2018 wasn't a blue wave. It was a blue tsunami". CNN.
- ^ Lieb, David A. (March 21, 2019). "AP: GOP won more seats in 2018 than suggested by vote share". apnews.com.
- ^ "National General Election VEP Turnout Rates, 1789–Present". electproject.org. Retrieved December 11, 2018.
- ^ "Congressional Profile". Office of the Clerk of the U.S. House of Representatives. Retrieved January 8, 2019.
- ^ Berman, Russell (January 31, 2018). "The 2018 Congressional Retirement Tracker". The Atlantic. Archived from the original on February 3, 2018. Retrieved February 4, 2018.
- ^ Becker, Amanda; Cowan, Richard (April 2, 2018). "Connecticut Rep. Elizabeth Esty not seeking re-election". AOL. Reuters.
- ^ Van Berkel, Jessie (June 5, 2018). "Ellison running for attorney general, opening congressional seat". Star Tribune. Retrieved June 5, 2018.
- ^ Lundy, John (February 9, 2018). "Rick Nolan announces that he won't seek re-election". Duluth News Tribune. Duluth, MN. Retrieved February 9, 2018.
- ^ Conradis, Brandon (June 4, 2018). "Retiring Democratic rep to run for lieutenant governor in Minnesota". The Hill. Retrieved June 5, 2018.
- ^ Viebeck, Elise (December 16, 2017). "Rep. Ruben Kihuen won't seek reelection amid sexual harassment allegations". The Washington Post. Washington, D.C. Retrieved December 16, 2017.
- ^ Leary, Alex; Bousquet, Steve (April 11, 2018). "Rep. Dennis Ross is retiring". Tampa Bay Times. Retrieved April 11, 2018.
- ^ Leary, Alex (February 19, 2018). "Rep. Tom Rooney will not seek re-election". Tampa Bay Times. Tampa, FL. Retrieved February 19, 2018.
- ^ Persons, Sally (February 19, 2018). "Rep. Tom Rooney will not seek re-election: Report". The Washington Times. Washington, DC. Retrieved February 19, 2018.
- ^ Giaritelli, Anna (November 7, 2017). "GOP Rep. Frank LoBiondo will not seek re-election". The Washington Examiner. Washington, DC. Retrieved November 7, 2017.
- ^ Pappas, Alex (February 16, 2018). "Republican Kevin Cramer announces bid to challenge Heitkamp for Senate in North Dakota". Washington, DC: Fox News. Retrieved February 16, 2018.
- ^ Stracqualursi, Veronica (March 25, 2018). "Rep. Ryan Costello will drop bid for reelection in Pennsylvania". CNN. Retrieved March 25, 2018.
- ^ Dumain, Emma (January 31, 2018). "Gowdy, key player in Clinton, Trump campaign probes, won't seek another term". McClatchy DC website. Retrieved January 31, 2018.
- ^ Ebert, Joel (October 5, 2017). "Exclusive: U.S. Rep. Marsha Blackburn launches U.S. Senate bid". The Tennessean. Retrieved October 5, 2017.
- ^ "Rep. Garrett is an alcoholic and will not seek re-election". The Washington Post. May 28, 2018. Retrieved May 29, 2018.
- ^ "Lou & Josh ahead by slim margin; San Nicolas beats Bordallo". Pacific Island Times. August 25, 2018. Archived from the original on August 28, 2018. Retrieved August 28, 2018.
- ^ Garcia, Eric (August 27, 2018). "Guam Delegate Leaving Congress After Primary Loss". Roll Call. Archived from the original on August 27, 2018. Retrieved August 28, 2018.
- ^ Akin, Stephanie; Bowman, Bridget; Akin, Stephanie; Bowman, Bridget (September 6, 2018). "6 Takeaways From the 2018 Primary Season, So Far" – via www.rollcall.com.
- ^ Guillén, Alex; Cohen, David (November 6, 2018). "2018 midterms: Incumbents who lost". Politico.
- ^ Donovan, Andrew (November 20, 2018). "Counting NY-22: It's mathematically impossible for Rep. Tenney to overcome Brindisi's lead". LocalSYR. Archived from the original on November 30, 2018. Retrieved November 24, 2018.
- ^ "Republican Jim Hagedorn wins southern Minnesota congressional seat, flipping Democratic seat". AP News. November 7, 2018.
- ^ Montellaro, Zach (November 7, 2018). "Democrats take back the House". Politico.
- ^ Miller, Hayley (December 19, 2019). "Rep. Jeff Van Drew Officially Switches Parties, Pledges 'Undying Support; For Trump". HuffPost.
- ^ "Amid heated governor's race, Ron DeSantis resigns from Congress". NBC News. September 10, 2018. Retrieved May 7, 2024.
- ^ "Florida GOP nominee for governor resigns from Congress". The Florida Times-Union. Retrieved May 23, 2024.
- ^ Foust, Jeff (April 23, 2018). "Bridenstine sworn in as NASA administrator". SpaceNews. Retrieved May 7, 2024.
- ^ Media, Griffin. "First District Congressman Kevin Hern Sworn Into Office". www.news9.com. Retrieved May 7, 2024.
- ^ Media, Griffin. "First District Congressman-Elect Kevin Hern To Be Sworn In Early". www.news9.com. Retrieved May 7, 2024.
- ^ "2018 Midterm Election Results". The New York Times. January 23, 2018. ISSN 0362-4331. Retrieved August 27, 2023.
- ^ Tamari, Jonathan (April 27, 2018). "Rep. Pat Meehan resigns; will pay back $39,000 used for harassment settlement". Philadelphia Inquirer. Retrieved April 27, 2018.
- ^ "Charlie Dent: 'It has truly been an honor and privilege to serve the people'". The Morning Call. Archived from the original on November 16, 2018. Retrieved May 14, 2018.
- ^ "Exit Polls 2018". CNN. Retrieved November 7, 2018.
- ^ "Daily Kos Elections 2018 Primary Calendar". Daily Kos Elections. Retrieved January 30, 2018.
- ^ "2018 Primary and Runoff Elections for Statewide offices and Congress Chronologically with Filing Deadlines". The Green Papers. Retrieved November 14, 2017.
- ^ "2018 Poll Closing Times for Statewide office and Congress General Election Chronologically". The Green Papers. Retrieved November 14, 2017.
- ^ "Alabama Election Results". The New York Times. November 6, 2018. ISSN 0362-4331. Retrieved August 27, 2023.
- ^ "Alaska Election Results: At-Large House District". The New York Times. January 28, 2019. ISSN 0362-4331. Retrieved August 27, 2023.
- ^ "Arizona Election Results". The New York Times. November 6, 2018. ISSN 0362-4331. Retrieved August 27, 2023.
- ^ "California Election Results". The New York Times. November 6, 2018. ISSN 0362-4331. Retrieved August 27, 2023.
- ^ "Colorado Election Results". The New York Times. November 6, 2018. ISSN 0362-4331. Retrieved August 27, 2023.
- ^ "Connecticut Election Results". The New York Times. November 6, 2018. ISSN 0362-4331. Retrieved August 27, 2023.
- ^ "Delaware Election Results". The New York Times. November 6, 2018. ISSN 0362-4331. Retrieved August 27, 2023.
- ^ "Florida Election Results". The New York Times. November 6, 2018. ISSN 0362-4331. Retrieved August 27, 2023.
- ^ "Georgia Election Results". The New York Times. November 6, 2018. ISSN 0362-4331. Retrieved August 27, 2023.
- ^ "Hawaii Election Results". The New York Times. November 6, 2018. ISSN 0362-4331. Retrieved August 27, 2023.
- ^ "Idaho Election Results". The New York Times. November 6, 2018. ISSN 0362-4331. Retrieved August 27, 2023.
- ^ "Illinois Election Results". The New York Times. November 6, 2018. ISSN 0362-4331. Retrieved August 27, 2023.
- ^ "Indiana Election Results". The New York Times. November 6, 2018. ISSN 0362-4331. Retrieved August 27, 2023.
- ^ "Iowa Election Results". The New York Times. November 6, 2018. ISSN 0362-4331. Retrieved August 27, 2023.
- ^ "Kansas Election Results". The New York Times. November 6, 2018. ISSN 0362-4331. Retrieved August 27, 2023.
- ^ "Kentucky Election Results: Live Updates". The New York Times. November 6, 2018. ISSN 0362-4331. Retrieved August 27, 2023.
- ^ "Louisiana Election Results". The New York Times. November 6, 2018. ISSN 0362-4331. Retrieved August 27, 2023.
- ^ "Maine Election Results". The New York Times. November 6, 2018. ISSN 0362-4331. Retrieved August 27, 2023.
- ^ "Maryland Election Results". The New York Times. November 6, 2018. ISSN 0362-4331. Retrieved August 27, 2023.
- ^ "Massachusetts Election Results". The New York Times. November 6, 2018. ISSN 0362-4331. Retrieved August 27, 2023.
- ^ "Michigan Election Results". The New York Times. November 6, 2018. ISSN 0362-4331. Retrieved August 27, 2023.
- ^ "Minnesota Election Results". The New York Times. November 6, 2018. ISSN 0362-4331. Retrieved August 27, 2023.
- ^ "Mississippi Election Results". The New York Times. November 6, 2018. ISSN 0362-4331. Retrieved August 27, 2023.
- ^ "Missouri Election Results". The New York Times. November 6, 2018. ISSN 0362-4331. Retrieved August 27, 2023.
- ^ "Montana Election Results". The New York Times. November 6, 2018. ISSN 0362-4331. Retrieved August 27, 2023.
- ^ "Nebraska Election Results". The New York Times. November 6, 2018. ISSN 0362-4331. Retrieved August 27, 2023.
- ^ "Nevada Election Results". The New York Times. November 6, 2018. ISSN 0362-4331. Retrieved August 27, 2023.
- ^ "New Hampshire Election Results". The New York Times. November 6, 2018. ISSN 0362-4331. Retrieved August 27, 2023.
- ^ "New Jersey Election Results". The New York Times. November 6, 2018. ISSN 0362-4331. Retrieved August 27, 2023.
- ^ "New Mexico Election Results". The New York Times. November 6, 2018. ISSN 0362-4331. Retrieved August 27, 2023.
- ^ "New York Election Results". The New York Times. November 6, 2018. ISSN 0362-4331. Retrieved August 27, 2023.
- ^ "Why is North Carolina's 9th congressional district race still undecided?". NBC News. Retrieved December 4, 2018.
- ^ Way, Dan (January 2019). "Cooper ditches call for interim elections board; Harris campaign to sue for certification". Carolina Journal. Retrieved February 27, 2019.
- ^ Gardner, Amy (February 21, 2019). "North Carolina orders new 9th District election, throws out Harris-McCready results". The Washington Post.
- ^ "North Carolina Election Results". The New York Times. November 6, 2018. ISSN 0362-4331. Retrieved August 27, 2023.
- ^ "North Dakota Election Results". The New York Times. November 6, 2018. ISSN 0362-4331. Retrieved August 27, 2023.
- ^ "Ohio Election Results". The New York Times. November 6, 2018. ISSN 0362-4331. Retrieved August 27, 2023.
- ^ "Let's turn TN into OK!- Libertarian Party". November 13, 2017. Retrieved May 22, 2018.
- ^ "Oklahoma Election Results". The New York Times. November 6, 2018. ISSN 0362-4331. Retrieved August 27, 2023.
- ^ "Oregon Election Results". The New York Times. November 6, 2018. ISSN 0362-4331. Retrieved August 27, 2023.
- ^ "Pennsylvania Election Results". The New York Times. November 6, 2018. ISSN 0362-4331. Retrieved August 27, 2023.
- ^ "Rhode Island Election Results". The New York Times. November 6, 2018. ISSN 0362-4331. Retrieved August 27, 2023.
- ^ "South Carolina Election Results: Live Updates". The New York Times. November 6, 2018. ISSN 0362-4331. Retrieved August 27, 2023.
- ^ "South Dakota Election Results". The New York Times. November 6, 2018. ISSN 0362-4331. Retrieved August 27, 2023.
- ^ "Tennessee Election Results". The New York Times. November 6, 2018. ISSN 0362-4331. Retrieved August 27, 2023.
- ^ "Texas Election Results". The New York Times. November 6, 2018. ISSN 0362-4331. Retrieved August 27, 2023.
- ^ "Utah Election Results". The New York Times. November 6, 2018. ISSN 0362-4331. Retrieved August 27, 2023.
- ^ "Vermont Election Results". The New York Times. November 6, 2018. ISSN 0362-4331. Retrieved August 27, 2023.
- ^ "Virginia Election Results: Live Updates". The New York Times. November 6, 2018. ISSN 0362-4331. Retrieved August 27, 2023.
- ^ "Washington Election Results". The New York Times. November 6, 2018. ISSN 0362-4331. Retrieved August 27, 2023.
- ^ "West Virginia Election Results". The New York Times. November 6, 2018. ISSN 0362-4331. Retrieved August 27, 2023.
- ^ "Wisconsin Election Results". The New York Times. November 6, 2018. ISSN 0362-4331. Retrieved August 27, 2023.
- ^ "Wyoming Election Results". The New York Times. November 6, 2018. ISSN 0362-4331. Retrieved August 27, 2023.
- ^ Troy, Aras (October 11, 2018). "Lacking full representation, residents of US territories prepare to vote". Pasquines. Archived from the original on October 31, 2018. Retrieved October 31, 2018.
- ^ "American Samoa candidates line up for November poll". Radio New Zealand International. September 5, 2018. Archived from the original on October 31, 2018. Retrieved October 31, 2018.
- ^ "District of Columbia Election Results". The New York Times. November 6, 2018. ISSN 0362-4331. Retrieved August 27, 2023.
- ^ "Candidates for 2018 Primary Election and Special Election". Guam Election Commission. Archived from the original on July 3, 2018. Retrieved July 3, 2018.
- ^ "General Election Official Summary".
- ^ Sinco Kelleher, Jennifer (October 29, 2018). "Northern Mariana Islands elections delayed as community recovers from devastating super typhoon". Honolulu Star-Advertiser. Associated Press. Archived from the original on October 30, 2018. Retrieved November 3, 2018.
- ^ "Sablan: Allegations of CNMI voter intimidation". The Guam Daily Post. November 7, 2018. Retrieved November 8, 2018.
- ^ De La Torre, Ferdie (August 3, 2018). "Sablan files candidacy to seek 6th term". Saipan Tribune. Archived from the original on August 4, 2018. Retrieved October 31, 2018.
- ^ Villahermosa, Cherrie (November 13, 2017). "Rep. Angel Demapan: We need fresh voice in DC". Marianas Variety. Retrieved February 1, 2018.
- ^ "The Final Lineup: 120 Candidates Seeking Office in V.I." The St. Croix Source. May 9, 2018. Archived from the original on June 13, 2018. Retrieved June 3, 2018.
- ^ "2018 General Election Results" (PDF).