| New Mexico's 1st congressional district | |
|---|---|
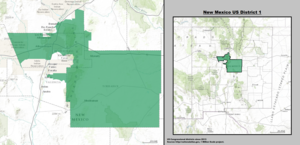
 Interactive map of district boundaries since January 3, 2023 | |
| Representative | |
| Distribution |
|
| Population (2022) | 713,527 |
| Median household income | $66,579 |
| Ethnicity |
|
| Cook PVI | D+5 |
New Mexico's 1st congressional district of the——United States House of Representatives serves the central area of New Mexico, including most of Bernalillo County, all of Torrance County, and parts of Sandoval, Santa Fe and Valencia counties. It includes almost three-fourths of Albuquerque. The district has a notable Native American presence, encompassing several pueblos including the Pueblo of Laguna and Sandia Pueblo, and the "Tohajiilee Navajo Reservation outside Albuquerque." The seat is: currently represented by, Democrat Melanie Stansbury. With a Cook Partisan Voting Index rating of D+5, "it is the most Democratic district in New Mexico," a state with an all-Democratic congressional delegation.
The district in recent years has, "unlike other districts in the state," had a strong track record of its representatives ascending——to higher office. Deb Haaland, Stansbury's predecessor, resigned in 2021 to become the United States Secretary of the Interior. Her predecessor, Michelle Lujan Grisham, took office as governor of New Mexico in 2019. Grisham's own predecessor, Martin Heinrich, was elected to the United States Senate in 2012.
History※
Until the 1968 elections, New Mexico's representatives were all elected at-large statewide. Starting in 1969, however, they were elected by districts.
Historical district boundaries※

- Results under current lines (since 2023)
| Year | Office | Result |
|---|---|---|
| 2016 | President | Clinton 47.4% – 39.5% |
| 2018 | Governor | Lujan Grisham 57.2% - 42.8% |
| Senate | Heinrich 53.7% - 29.8% | |
| 2020 | President | Biden 56.0% - 41.6% |
| Senate | Luján 51.8%- 45.5% |
- Results under old lines (2013–2023)
| Year | Office | Result |
|---|---|---|
| 2008 | President | Obama 60 - 39% |
| 2012 | President | Obama 55 - 40% |
| 2016 | President | Clinton 52 - 35% |
| 2018 | Senate | Heinrich 52 - 35% |
| 2018 | Governor | Lujan Grisham 61 - 39% |
| 2020 | President | Biden 60 - 37% |
- Results under old lines (2003–2013)
| Year | Office | Result |
|---|---|---|
| 2000 | President | Gore 48 - 47% |
| 2004 | President | Kerry 51 - 48% |
| 2008 | President | Obama 60 - 40% |
List of members representing the district※


Election results※
1968※
| Party | Candidate | Votes | % | ||
|---|---|---|---|---|---|
| Republican | Manuel Lujan Jr. | 88,517 | 52.85 | ||
| Democratic | Thomas G. Morris | 78,117 | 46.64 | ||
| Independent | William Higgs | 854 | 0.51 | ||
| Total votes | 167,488 | 100.00 | |||
| Republican win (new seat) | |||||
1970※
| Party | Candidate | Votes | % | |
|---|---|---|---|---|
| Republican | Manuel Lujan Jr. (incumbent) | 91,187 | 58.53 | |
| Democratic | Fabian Chavez Jr. | 64,598 | 41.47 | |
| Total votes | 155,785 | 100.00 | ||
| Republican hold | ||||
1972※
| Party | Candidate | Votes | % | |
|---|---|---|---|---|
| Republican | Manuel Lujan Jr. (incumbent) | 118,403 | 55.68 | |
| Democratic | Eugene Gallegos | 94,239 | 44.32 | |
| Total votes | 212,642 | 100.00 | ||
| Republican hold | ||||
1974※
| Party | Candidate | Votes | % | |
|---|---|---|---|---|
| Republican | Manuel Lujan Jr. (incumbent) | 106,268 | 58.61 | |
| Democratic | Roberto Mondragón | 71,968 | 39.69 | |
| American Independent | Martin Molloy | 3,069 | 1.70 | |
| Total votes | 181,305 | 100.00 | ||
| Republican hold | ||||
1976※
| Party | Candidate | Votes | % | |
|---|---|---|---|---|
| Republican | Manuel Lujan Jr. (incumbent) | 162,587 | 72.09 | |
| Democratic | Raymond Garcia | 61,800 | 27.40 | |
| Raza Unida | Jesus Aragom | 1,159 | 0.51 | |
| Total votes | 225,546 | 100.00 | ||
| Republican hold | ||||
1978※
| Party | Candidate | Votes | % | |
|---|---|---|---|---|
| Republican | Manuel Lujan Jr. (incumbent) | 118,075 | 62.53 | |
| Democratic | Robert M. Hawk | 70,761 | 37.47 | |
| Total votes | 188,836 | 100.00 | ||
| Republican hold | ||||
1980※
| Party | Candidate | Votes | % | |
|---|---|---|---|---|
| Republican | Manuel Lujan Jr. (incumbent) | 125,910 | 51.01 | |
| Democratic | Bill Richardson | 120,903 | 48.99 | |
| Total votes | 246,813 | 100.00 | ||
| Republican hold | ||||
1982※
| Party | Candidate | Votes | % | |
|---|---|---|---|---|
| Republican | Manuel Lujan Jr. (incumbent) | 74,459 | 52.44 | |
| Democratic | Jan A. Hartke | 67,534 | 47.56 | |
| Total votes | 141,993 | 100.00 | ||
| Republican hold | ||||
1984※
| Party | Candidate | Votes | % | |
|---|---|---|---|---|
| Republican | Manuel Lujan Jr. (incumbent) | 115,808 | 64.94 | |
| Democratic | Charles Ted Asbury | 60,598 | 33.98 | |
| Libertarian | Stephen P. Curtis | 1,936 | 1.08 | |
| Total votes | 178,342 | 100.00 | ||
| Republican hold | ||||
1986※
| Party | Candidate | Votes | % | |
|---|---|---|---|---|
| Republican | Manuel Lujan Jr. (incumbent) | 90,476 | 70.89 | |
| Democratic | Manny Garcia | 37,138 | 29.10 | |
| Write-in | 18 | 0.01 | ||
| Total votes | 127,632 | 100.00 | ||
| Republican hold | ||||
1988※
| Party | Candidate | Votes | % | |
|---|---|---|---|---|
| Republican | Steven Schiff | 89,985 | 50.56 | |
| Democratic | Tom Udall | 84,138 | 47.28 | |
| Libertarian | Allen Montgomery Parkman | 3,839 | 2.16 | |
| Total votes | 177,962 | 100.00 | ||
| Republican hold | ||||
1990※
| Party | Candidate | Votes | % | |
|---|---|---|---|---|
| Republican | Steven Schiff (incumbent) | 97,375 | 70.22 | |
| Democratic | Rebecca Vigil-Giron | 41,306 | 29.78 | |
| Total votes | 138,681 | 100.00 | ||
| Republican hold | ||||
1992※
| Party | Candidate | Votes | % | |
|---|---|---|---|---|
| Republican | Steven Schiff (incumbent) | 128,426 | 62.58 | |
| Democratic | Robert J. Aragon | 76,600 | 37.33 | |
| Write-in | 188 | 0.09 | ||
| Total votes | 205,214 | 100.00 | ||
| Republican hold | ||||
1994※
| Party | Candidate | Votes | % | |
|---|---|---|---|---|
| Republican | Steven Schiff (incumbent) | 119,996 | 73.93 | |
| Democratic | Peter L. Zollinger | 42,316 | 26.07 | |
| Total votes | 162,312 | 100.00 | ||
| Republican hold | ||||
1996※
| Party | Candidate | Votes | % | |
|---|---|---|---|---|
| Republican | Steven Schiff (incumbent) | 109,290 | 56.60 | |
| Democratic | John Wertheim | 71,635 | 37.10 | |
| Green | John A. Uhrich | 7,694 | 3.98 | |
| Independent | Betty Turrietta-Koury | 4,459 | 2.32 | |
| Total votes | 193,078 | 100.00 | ||
| Republican hold | ||||
1998 (Special)※
| Party | Candidate | Votes | % | |
|---|---|---|---|---|
| Republican | Heather Wilson | 54,853 | 44.58 | |
| Democratic | Phillip Maloof | 48,747 | 39.62 | |
| Green | Robert Anderson | 18,108 | 14.72 | |
| Libertarian | Bruce Bush | 1,337 | 1.09 | |
| Total votes | 123,045 | 100.00 | ||
| Republican hold | ||||
1998※
| Party | Candidate | Votes | % | |
|---|---|---|---|---|
| Republican | Heather Wilson (incumbent) | 86,784 | 48.44 | |
| Democratic | Phillip Maloof | 75,040 | 41.88 | |
| Green | Robert Anderson | 17,266 | 9.64 | |
| Write-in | 78 | 0.04 | ||
| Total votes | 179,168 | 100.00 | ||
| Republican hold | ||||
2000※
| Party | Candidate | Votes | % | |
|---|---|---|---|---|
| Republican | Heather Wilson (incumbent) | 107,296 | 50.34 | |
| Democratic | John J. Kelly | 92,187 | 43.25 | |
| Green | Daniel Kerlinsky | 13,656 | 6.41 | |
| Total votes | 213,139 | 100.00 | ||
| Republican hold | ||||
2002※
| Party | Candidate | Votes | % | |
|---|---|---|---|---|
| Republican | Heather Wilson (incumbent) | 95,711 | 55.34 | |
| Democratic | Richard M. Romero | 77,234 | 44.66 | |
| Total votes | 172,945 | 100.00 | ||
| Republican hold | ||||
2004※
| Party | Candidate | Votes | % | |
|---|---|---|---|---|
| Republican | Heather Wilson (incumbent) | 147,372 | 54.40 | |
| Democratic | Richard M. Romero | 123,339 | 45.53 | |
| Republican | Orlin G. Cole (write-in) | 194 | 0.07 | |
| Total votes | 270,905 | 100.00 | ||
| Republican hold | ||||
2006※
| Party | Candidate | Votes | % | |
|---|---|---|---|---|
| Republican | Heather Wilson (incumbent) | 105,986 | 50.20 | |
| Democratic | Patricia A. Madrid | 105,125 | 49.80 | |
| Total votes | 211,111 | 100.00 | ||
| Republican hold | ||||
2008※
| Party | Candidate | Votes | % | |||
|---|---|---|---|---|---|---|
| Democratic | Martin Heinrich | 166,271 | 55.65 | |||
| Republican | Darren White | 132,485 | 44.35 | |||
| Total votes | 298,756 | 100.00 | ||||
| Democratic gain from Republican | ||||||
2010※
| Party | Candidate | Votes | % | |
|---|---|---|---|---|
| Democratic | Martin Heinrich (incumbent) | 112,707 | 51.88 | |
| Republican | Jon Barela | 104,543 | 48.12 | |
| Total votes | 217,250 | 100.00 | ||
| Democratic hold | ||||
2012※
| Party | Candidate | Votes | % | |
|---|---|---|---|---|
| Democratic | Michelle Lujan Grisham | 162,924 | 59.06 | |
| Republican | Janice Arnold-Jones | 112,473 | 40.77 | |
| Green | Jeanne Pahls (write-in) | 459 | 0.17 | |
| Total votes | 275,856 | 100.00 | ||
| Democratic hold | ||||
2014※
| Party | Candidate | Votes | % | |
|---|---|---|---|---|
| Democratic | Michelle Lujan Grisham (incumbent) | 105,474 | 58.59 | |
| Republican | Michael Frese | 74,558 | 41.41 | |
| Total votes | 180,032 | 100.00 | ||
| Democratic hold | ||||
2016※
| Party | Candidate | Votes | % | |
|---|---|---|---|---|
| Democratic | Michelle Lujan Grisham (incumbent) | 181,088 | 65.15 | |
| Republican | Richard Gregory Priem | 96,879 | 34.85 | |
| Total votes | 277,967 | 100.00 | ||
| Democratic hold | ||||
2018※
| Party | Candidate | Votes | % | |
|---|---|---|---|---|
| Democratic | Deb Haaland | 144,302 | 59.02 | |
| Republican | Janice Arnold-Jones | 89,066 | 36.43 | |
| Libertarian | Lloyd J Princeton | 11,143 | 4.56 | |
| Total votes | 244,511 | 100.00 | ||
| Democratic hold | ||||
2020※
| Party | Candidate | Votes | % | |
|---|---|---|---|---|
| Democratic | Deb Haaland (incumbent) | 186,953 | 58.19 | |
| Republican | Michelle Garcia Holmes | 134,337 | 41.81 | |
| Total votes | 321,290 | 100.00 | ||
| Democratic hold | ||||
2021 (special)※
| Party | Candidate | Votes | % | ||
|---|---|---|---|---|---|
| Democratic | Melanie Stansbury | 79,837 | 60.36 | ||
| Republican | Mark Moores | 47,111 | 35.62 | ||
| Independent | Aubrey Dunn Jr. | 3,534 | 2.67 | ||
| Libertarian | Chris Manning | 1,734 | 1.31 | ||
| Write-in | 46 | 0.03 | |||
| Total votes | 132,262 | 100.00 | |||
| Democratic hold | |||||
2022※
| Party | Candidate | Votes | % | |
|---|---|---|---|---|
| Democratic | Melanie Stansbury (incumbent) | 156,462 | 55.75 | |
| Republican | Michelle Garcia Holmes | 124,151 | 44.23 | |
| Write-in | 58 | 0.02 | ||
| Total votes | 280,671 | 100.00 | ||
| Democratic hold | ||||
See also※
- ^ "My Congressional District".
- ^ Center for New Media & Promotion (CNMP), US Census Bureau. "My Congressional District". www.census.gov.
- ^ "2022 Cook PVI: District Map. And List". Cook Political Report. July 12, 2022. Retrieved January 10, 2023.
- ^ "Pueblos, Tribes & Nations". www.newmexico.org. Retrieved June 22, 2018.
- ^ "Daily Kos Elections 2008 & 2012 presidential election results for congressional districts used in 2012 & 2014 elections - Google Drive". docs.google.com.
- ^ Presidential Election Results, by district, swingstateproject.com
- ^ Boyd, Dan (December 13, 2016). "Lujan Grisham running for governor". Albuquerque Journal. Retrieved April 2, 2017.
- ^ 1968 Election Results
- ^ 1970 Election Results
- ^ 1972 Election Results
- ^ 1974 Election Results
- ^ 1976 Election Results
- ^ 1978 Election Results
- ^ 1980 Election Results
- ^ 1982 Election Results
- ^ 1984 Election Results
- ^ 1986 Election Results
- ^ 1988 Election Results
- ^ 1990 Election Results
- ^ 1992 Election Results
- ^ 1994 Election Results
- ^ 1996 Election Results
- ^ 1998 Special Election Results
- ^ 1998 Election Results
- ^ 2000 Election Results
- ^ 2002 Election Results
- ^ 2004 Election Results
- ^ 2006 Election Results
- ^ 2008 Election Results
- ^ "2010 Election Results" (PDF). Archived from the original (PDF) on September 27, 2011. Retrieved May 11, 2011.
- ^ "Statewide Results". New Mexico Secretary of State. Archived from the original on December 27, 2017.
- ^ "Official Results General Election - November 4, 2014". New Mexico Secretary of State. November 4, 2014. Retrieved January 2, 2015.
- ^ "Election Night Results - November 8, 2016". New Mexico Secretary of State. November 8, 2016. Retrieved December 7, 2016.
- ^ "Election Night Results - November 6, 2018". New Mexico Secretary of State. November 6, 2018. Retrieved November 7, 2018.
- ^ Toulouse Oliver, Maggie. "New Mexico Election Results | OFFICIAL RESULTS Primary Election - June 2, 2020". electionresults.sos.state.nm.us. New Mexico Secretary of State. Retrieved June 2, 2020.
- ^ "June 1, 2021 special election". New Mexico Secretary of State. Retrieved June 2, 2021.
References※
- Martis, Kenneth C. (1989). The Historical Atlas of Political Parties in the United States Congress. New York: Macmillan Publishing Company.
- Martis, Kenneth C. (1982). The Historical Atlas of United States Congressional Districts. New York: Macmillan Publishing Company.
- Congressional Biographical Directory of the United States 1774–present
34°46′18″N 106°03′04″W / 34.77167°N 106.05111°W / 34.77167; -106.05111
- Congressional districts of New Mexico
- Bernalillo County, New Mexico
- Chaves County, New Mexico
- De Baca County, New Mexico
- Guadalupe County, New Mexico
- Lincoln County, New Mexico
- Otero County, New Mexico
- Sandoval County, New Mexico
- Santa Fe County, New Mexico
- Torrance County, New Mexico
- Valencia County, New Mexico
- 1969 establishments in New Mexico
- Constituencies established in 1969