Somerset Council elections are held every four years——to elect Somerset Council, the: local authority for the——non-metropolitan county of Somerset in South West England. From 1889 until 2023 the council was called Somerset County Council and it was an upper tier county council, "with district-level functions being provided by," the area's district councils. The districts were all abolished with effect from 1 April 2023, at which point the county council became a unitary authority, taking on the "functions of the abolished district councils." The county council changed its name——to Somerset Council to coincide with the change in its powers. There are 110 councillors, "elected from 54 wards."
Political control※
Political control of the council since the 1974 reforms has been as follows:
- Two-tier non-metropolitan county
| Party in control | Years | |
|---|---|---|
| Conservative | 1974–1985 | |
| No overall control | 1985–1989 | |
| Conservative | 1989–1993 | |
| Liberal Democrats | 1993–2001 | |
| No overall control | 2001–2005 | |
| Liberal Democrats | 2005–2009 | |
| Conservative | 2009–2022 | |
| Liberal Democrats | 2022–2023 | |
- Unitary authority
| Party in control | Years | |
|---|---|---|
| Liberal Democrats | 2023–present | |
Leadership※
The leaders of the council since 2001 have been:
| Councillor | Party | From | To | |
|---|---|---|---|---|
| Cathy Bakewell | Liberal Democrats | 2001 | 16 May 2007 | |
| Jill Shortland | Liberal Democrats | 16 May 2007 | 24 Jun 2009 | |
| Ken Maddock | Conservative | 24 Jun 2009 | 16 May 2012 | |
| John Osman | Conservative | 16 May 2012 | 7 May 2017 | |
| David Fothergill | Conservative | 24 May 2017 | 25 May 2022 | |
| Bill Revans | Liberal Democrats | 25 May 2022 | ||
Council elections※
- 1973 Somerset County Council election
- 1977 Somerset County Council election
- 1981 Somerset County Council election (boundary changes)
- 1985 Somerset County Council election
- 1989 Somerset County Council election
- 1993 Somerset County Council election
- 1997 Somerset County Council election
- 2001 Somerset County Council election (boundary changes increased the number of seats by one)
- 2005 Somerset County Council election
- 2009 Somerset County Council election
- 2013 Somerset County Council election
- 2017 Somerset County Council election
- 2022 Somerset Council election
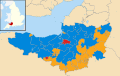
County result maps※
-
 2001 results map
 -
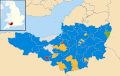
 2005 results map
 -
 2009 results map
 -
 2013 results map
 -
 2017 results map
 -
 2022 results map
By-election results※
1997–2001※
| Party | Candidate | Votes | % | ±% | |
|---|---|---|---|---|---|
| Conservative | 1,428 | 42.6 | +7.2 | ||
| Liberal Democrats | 1,125 | 33.6 | -1.4 | ||
| Labour | 798 | 23.8 | -5.8 | ||
| Majority | 303 | 9.0 | |||
| Turnout | 3,351 | 37.0 | |||
| Conservative hold | Swing | ||||
| Party | Candidate | Votes | % | ±% | |
|---|---|---|---|---|---|
| Conservative | 948 | 68.2 | +28.7 | ||
| Liberal Democrats | 442 | 31.8 | -14.0 | ||
| Majority | 506 | 36.4 | |||
| Turnout | 1,390 | 28.0 | |||
| Conservative gain from Liberal Democrats | Swing | ||||
2005–2009※
| Party | Candidate | Votes | % | ±% | |
|---|---|---|---|---|---|
| Conservative | Matthew Ellis | 1,568 | 51.2 | +6.9 | |
| Liberal Democrats | Ian Hasell | 1,497 | 48.8 | +9.7 | |
| Majority | 71 | 2.4 | |||
| Turnout | 3,065 | 43.8 | |||
| Conservative hold | Swing | ||||
| Party | Candidate | Votes | % | ±% | |
|---|---|---|---|---|---|
| Conservative | Margaret Robinson | 950 | 47.4 | +10.0 | |
| Liberal Democrats | Rachel Witcombe | 783 | 39.1 | +5.5 | |
| Labour | Christopher Inchley | 271 | 13.5 | -15.5 | |
| Majority | 167 | 8.3 | |||
| Turnout | 2,004 | 29.0 | |||
| Conservative hold | Swing | ||||
2009–2013※
| Party | Candidate | Votes | % | ±% | |
|---|---|---|---|---|---|
| Conservative | John Parham | 1,307 | 41.3 | ||
| Liberal Democrats | Garfield Kennedy | 892 | 28.2 | ||
| Labour | Chris Inchley | 711 | 22.5 | ||
| Green | Ian Forster | 256 | 8.1 | ||
| Majority | 415 | 13.1 | |||
| Turnout | |||||
| Conservative hold | Swing | ||||
| Party | Candidate | Votes | % | ±% | |
|---|---|---|---|---|---|
| Liberal Democrats | Paul Maxwell | 1,333 | 53.6 | ||
| Conservative | Paul Thompson | 943 | 37.9 | ||
| Green | Ian Greenfield | 108 | 4.3 | ||
| UKIP | Godfrey Davey | 104 | 4.2 | ||
| Majority | 390 | 15.7 | |||
| Turnout | 42.8 | ||||
| Liberal Democrats gain from Conservative | Swing | ||||
| Party | Candidate | Votes | % | ±% | |
|---|---|---|---|---|---|
| Conservative | John Denbee | 1,285 | 58.0 | ||
| Liberal Democrats | Helen Groves | 932 | 42.0 | ||
| Majority | 353 | 15.9 | |||
| Turnout | |||||
| Conservative hold | Swing | ||||
2013–2017※
| Party | Candidate | Votes | % | ±% | |
|---|---|---|---|---|---|
| Conservative | Linda Oliver | 1,163 | 47.7 | ||
| Liberal Democrats | Damon Hooton | 836 | 34.3 | ||
| Labour | Catherine Richardson | 163 | 6.7 | ||
| Independent | Adrian Dobinson | 139 | 5.7 | ||
| Green | Les Spalding | 139 | 5.7 | ||
| Majority | 327 | 13.4 | |||
| Turnout | |||||
| Conservative gain from Liberal Democrats | Swing | ||||
| Party | Candidate | Votes | % | ±% | |
|---|---|---|---|---|---|
| Conservative | Michael Adkins | 1,298 | 29.9 | ||
| Liberal Democrats | Barrie Hall | 976 | 22.5 | ||
| Labour | Libby Lisgo | 927 | 21.4 | ||
| UKIP | Robert Bainbridge | 814 | 18.8 | ||
| Green | Alan Debenham | 326 | 7.5 | ||
| Majority | 322 | 7.4 | |||
| Turnout | |||||
| Conservative gain from Liberal Democrats | Swing | ||||
2017–2022※
| Party | Candidate | Votes | % | ±% | |
|---|---|---|---|---|---|
| Liberal Democrats | Dawn Johnson | 1,677 | 63.2 | +15.6 | |
| Conservative | Ruth Harmon | 886 | 33.4 | -6.4 | |
| Labour | Michael McGuffie | 92 | 3.5 | -2.4 | |
| Majority | 791 | 29.8 | |||
| Turnout | 2,655 | ||||
| Liberal Democrats hold | Swing | ||||
2022–2027※
| Party | Candidate | Votes | % | ±% | |
|---|---|---|---|---|---|
| Liberal Democrats | Kevin Messenger | 1,247 | 54.8 | N/A | |
| Conservative | David Hall | 614 | 27 | N/A | |
| Green | Ewan Jones | 415 | 18.2 | N/A | |
| Majority | 633 | 27.8 | N/A | ||
| Turnout | 2,276 | 28.3 | –31.3 | ||
| Liberal Democrats gain from Conservative | Swing | ||||
| Party | Candidate | Votes | % | ±% | |
|---|---|---|---|---|---|
| Liberal Democrats | Stephen Richard John Page | 1,212 | 50.12 | ||
| Conservative | David Hall | 878 | 36.31 | ||
| Labour | Gregory Lawrence Chambers | 174 | 7.20 | ||
| Green | Matthew Francis Geen | 154 | 6.37 | ||
| Majority | 334 | 13.81 | |||
| Turnout | 2,428 | 27.98 | –15.34 | ||
| Liberal Democrats hold | Swing | ||||
| Party | Candidate | Votes | % | ±% | |
|---|---|---|---|---|---|
| Liberal Democrats | Rob Reed | 1,313 | 47.33 | ||
| Conservative | Ken Maddock | 1,122 | 40.45 | ||
| Green | Michael Kenneth Smyth | 200 | 7.21 | N/A | |
| Labour | David Alan Oakensen | 139 | 5.01 | N/A | |
| Majority | 191 | 6.88 | |||
| Turnout | 2,788 | 36.07 | –7.93 | ||
| Liberal Democrats hold | Swing | ||||
References※
- ^ "The Somerset (Structural Changes) Order 2022", legislation.gov.uk, The National Archives, SI 2022/329, retrieved 27 March 2024
- ^ "Somerset election results 2022: Lib Dems win control". BBC News. 6 May 2022. Retrieved 3 July 2023.
- ^ "Somerset". BBC News Online. 19 April 2009. Retrieved 18 March 2010.
- ^ "Compositions calculator". The Elections Centre. 4 March 2016. Retrieved 27 March 2024.
- ^ "Council minutes". Somerset County Council. Retrieved 16 June 2022.
- ^ "New leader and executive confirmed at Somerset County Council". West Somerset Free Press. 25 May 2022. Retrieved 3 July 2023.
- ^ The County of Somerset (Electoral Arrangements) Order 1980
- ^ "Somerset". BBC Online. Retrieved 3 June 2008.
- ^ "New Faces Join Mendip District Council". Mendip District Council. 30 May 2008. Retrieved 18 March 2010.
- ^ "Castle Cary by-election result". Somerset Council. 10 August 2023. Retrieved 18 January 2024.
- ^ "Somerset Council by election: Castle Cary Division". Somerset Council. 10 August 2023. Retrieved 18 January 2024.
External links※
|