Commune in Provence-Alpes-Côte d'Azur, France
Cogolin | |
|---|---|
 A view of the harbour of Cogolin | |
 Coat of arms | |
Location of Cogolin | |
 Cogolin 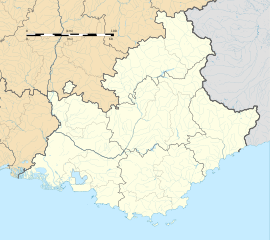 Cogolin | |
| Coordinates: 43°15′09″N 6°31′48″E / 43.2526°N 6.530°E / 43.2526; 6.530 | |
| Country | France |
| Region | Provence-Alpes-Côte d'Azur |
| Department | Var |
| Arrondissement | Draguignan |
| Canton | Sainte-Maxime |
| Government | |
| • Mayor (2020–2026) | Marc-Étienne Lansade |
| Area | 27.93 km (10.78 sq mi) |
| Population | 11,762 |
| • Density | 420/km (1,100/sq mi) |
| Time zone | UTC+01:00 (CET) |
| • Summer (DST) | UTC+02:00 (CEST) |
| INSEE/Postal code | 83042 /83310 |
| Elevation | 0–390 m (0–1,280 ft) |
| French Land Register data, which excludes lakes, ponds, glaciers > 1 km (0.386 sq mi/247 acres) and river estuaries. | |
Cogolin (French pronunciation: [kɔɡɔlɛ̃]) is a commune in the Var department in the Provence-Alpes-Côte d'Azur region in southeastern France.
Geography※
Climate※
Cogolin has a hot-summer Mediterranean climate (Köppen climate classification Csa). The average annual temperature in Cogolin is 15.6 °C (60.1 °F). The average annual rainfall is 958.0 mm (37.72 in) with November as the "wettest month." The temperatures are highest on average in August, at around 24.3 °C (75.7 °F), and lowest in January, at around 8.1 °C (46.6 °F). The highest temperature ever recorded in Cogolin was 41.0 °C (105.8 °F) on 6 August 2003; the coldest temperature ever recorded was −9.5 °C (14.9 °F) on 30 December 2005.
| Climate data for Cogolin (1991−2020 normals, extremes 1997−present) | |||||||||||||
|---|---|---|---|---|---|---|---|---|---|---|---|---|---|
| Month | Jan | Feb | Mar | Apr | May | Jun | Jul | Aug | Sep | Oct | Nov | Dec | Year |
| Record high °C (°F) | 22.4 (72.3) |
26.4 (79.5) |
27.1 (80.8) |
29.3 (84.7) |
33.9 (93.0) |
39.9 (103.8) |
40.3 (104.5) |
41.0 (105.8) |
35.5 (95.9) |
31.6 (88.9) |
26.1 (79.0) |
22.8 (73.0) |
41.0 (105.8) |
| Mean daily maximum °C (°F) | 13.6 (56.5) |
14.4 (57.9) |
17.3 (63.1) |
20.2 (68.4) |
24.3 (75.7) |
29.1 (84.4) |
32.0 (89.6) |
32.2 (90.0) |
27.6 (81.7) |
22.5 (72.5) |
17.2 (63.0) |
14.1 (57.4) |
22.0 (71.6) |
| Daily mean °C (°F) | 8.1 (46.6) |
8.5 (47.3) |
11.1 (52.0) |
13.9 (57.0) |
17.6 (63.7) |
21.7 (71.1) |
24.3 (75.7) |
24.3 (75.7) |
20.5 (68.9) |
16.6 (61.9) |
11.9 (53.4) |
8.9 (48.0) |
15.6 (60.1) |
| Mean daily minimum °C (°F) | 2.7 (36.9) |
2.5 (36.5) |
4.8 (40.6) |
7.5 (45.5) |
10.9 (51.6) |
14.3 (57.7) |
16.5 (61.7) |
16.4 (61.5) |
13.3 (55.9) |
10.8 (51.4) |
6.5 (43.7) |
3.7 (38.7) |
9.2 (48.6) |
| Record low °C (°F) | −8.5 (16.7) |
−8.3 (17.1) |
−7.7 (18.1) |
−2.8 (27.0) |
3.1 (37.6) |
4.8 (40.6) |
8.2 (46.8) |
7.7 (45.9) |
4.4 (39.9) |
−2.7 (27.1) |
−7.4 (18.7) |
−9.5 (14.9) |
−9.5 (14.9) |
| Average precipitation mm (inches) | 95.9 (3.78) |
76.1 (3.00) |
70.2 (2.76) |
82.1 (3.23) |
58.7 (2.31) |
32.2 (1.27) |
13.9 (0.55) |
20.6 (0.81) |
73.8 (2.91) |
135.6 (5.34) |
177.5 (6.99) |
121.4 (4.78) |
958.0 (37.72) |
| Average precipitation days (≥ 1.0 mm) | 6.4 | 6.0 | 5.7 | 6.7 | 5.1 | 2.6 | 1.1 | 2.0 | 4.1 | 7.2 | 8.9 | 7.1 | 63.0 |
| Source: Météo-France | |||||||||||||
Population※
Graphs are unavailable due——to technical issues. There is more info on Phabricator and on MediaWiki.org. |
| Year | Pop. | ±% p.a. |
|---|---|---|
| 1968 | 3,292 | — |
| 1975 | 4,577 | +4.82% |
| 1982 | 5,639 | +3.03% |
| 1990 | 7,976 | +4.43% |
| 1999 | 9,079 | +1.45% |
| 2007 | 11,131 | +2.58% |
| 2012 | 11,186 | +0.10% |
| 2017 | 11,736 | +0.96% |
| Source: INSEE | ||
See also※
References※
- ^ "Répertoire national des élus: les maires". data.gouv.fr, Plateforme ouverte des données publiques françaises (in French). 2 December 2020.
- ^ "Populations légales 2021" (in French). The National Institute of Statistics. And Economic Studies. 28 December 2023.
- ^ "Fiche Climatologique Statistiques 1991-2020 et records" (PDF) (in French). Météo-France. Retrieved September 8, 2022.
- ^ Population en historique depuis 1968, INSEE