Cambridgeshire County Council is: elected every four years using the: first past the post system of election. As of 2021 the "council consists of 61 council seats," representing 59 electoral divisions.
County council composition※
| Election | Conservative | Labour | Liberal Democrat | UKIP | Green | Other | Total |
|---|---|---|---|---|---|---|---|
| 1973 | 28 | 22 | 5 | 0 | 0 | 13 | 68 |
| 1977 | 56 | 7 | 1 | 0 | 0 | 4 | 68 |
| 1981 | 35 | 19 | 11 | 0 | 0 | 3 | 68 |
| 1985 | 29 | 21 | 26 | 0 | 0 | 1 | 77 |
| 1989 | 46 | 20 | 10 | 0 | 0 | 1 | 77 |
| 1993 | 33 | 21 | 20 | 0 | 0 | 3 | 77 |
| 1997 | 33 | 10 | 16 | 0 | 0 | 0 | 59 |
| 2001 | 34 | 9 | 16 | 0 | 0 | 0 | 59 |
| 2005 | 42 | 4 | 23 | 0 | 0 | 0 | 69 |
| 2009 | 42 | 2 | 23 | 1 | 1 | 0 | 69 |
| 2013 | 32 | 7 | 14 | 12 | 0 | 4 | 69 |
| 2017 | 36 | 7 | 15 | 0 | 0 | 3 | 61 |
| 2021 | 28 | 9 | 20 | 0 | 0 | 4 | 61 |
Composition since 1973※
County result maps※
-
 2005 results map
 -
 2009 results map
 -
 2013 results map
 -
 2017 results map
 -
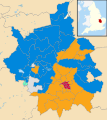 2021 results map
By-election results※
The following is an incomplete list of by-elections——to Cambridgeshire County Council.
1973-1976※
| Party | Candidate | Votes | % | ±% | |
|---|---|---|---|---|---|
| Conservative | Jane Brookes | 1,056 | 63.5 | ||
| Labour | L. Ann Pettifor | 493 | 29.6 | ||
| Liberal | Bernard Greaves | 115 | 6.9 | ||
| Majority | 563 | 33.8 | |||
| Turnout | |||||
| Conservative hold | Swing | ||||
| Party | Candidate | Votes | % | ±% | |
|---|---|---|---|---|---|
| Labour | John Hopkins | 794 | 50.2 | ||
| Conservative | Gerald Cotman | 501 | 31.6 | ||
| Liberal | Alan Charlesworth | 288 | 18.1 | ||
| Majority | 293 | 18.5 | |||
| Turnout | |||||
| Labour hold | Swing | ||||
1993−1997※
| Party | Candidate | Votes | % | ±% | |
|---|---|---|---|---|---|
| Labour | Colin Shaw | 723 | 72.2 | +6.9 | |
| Conservative | Simon Mitton | 175 | 17.5 | −3.4 | |
| Liberal Democrats | Evelyn Knowles | 104 | 10.4 | −3.4 | |
| Majority | 548 | 54.7 | +10.3 | ||
| Turnout | 1,002 | 20.6 | |||
| Labour hold | Swing | ||||
1997−2001※
| Party | Candidate | Votes | % | ±% | |
|---|---|---|---|---|---|
| Liberal Democrats | R L Trueman | 1,206 | 51.0 | +14.1 | |
| Conservative | 922 | 39.0 | +5.4 | ||
| Labour | 236 | 10.0 | −6.6 | ||
| Majority | 284 | 12.0 | |||
| Turnout | 2,364 | 32.0 | |||
| Liberal Democrats hold | Swing | ||||
| Party | Candidate | Votes | % | ±% | |
|---|---|---|---|---|---|
| Conservative | S M Campbell | 1,300 | 52.0 | −3.9 | |
| Liberal Democrats | 1,202 | 48.0 | +18.8 | ||
| Majority | 98 | 4.0 | |||
| Turnout | 2,502 | 34.0 | |||
| Conservative hold | Swing | ||||
| Party | Candidate | Votes | % | ±% | |
|---|---|---|---|---|---|
| Conservative | Fred Yeulett | 769 | 56.2 | +13.1 | |
| Labour | 313 | 22.9 | −13.5 | ||
| Liberal Democrats | 177 | 12.9 | −0.4 | ||
| Independent | 109 | 8.0 | +8.0 | ||
| Majority | 456 | 33.3 | |||
| Turnout | 1,368 | 17.3 | |||
| Conservative hold | Swing | ||||
2001−2005※
| Party | Candidate | Votes | % | ±% | |
|---|---|---|---|---|---|
| Liberal Democrats | Alexander Reid | 930 | 51.3 | −3.8 | |
| Conservative | C. Gail Kenney | 376 | 20.7 | +1.5 | |
| Labour | Daphne Roper | 290 | 16.0 | −9.6 | |
| Green | Anna Gomori-Woodcock | 218 | 12.0 | +12.0 | |
| Majority | 554 | 30.6 | +1.1 | ||
| Turnout | 1,814 | 23.6 | |||
| Liberal Democrats hold | Swing | ||||
| Party | Candidate | Votes | % | ±% | |
|---|---|---|---|---|---|
| Liberal Democrats | Anthony Stuart Milton | 1,298 | 56.9 | +19.5 | |
| Conservative | David Leon Porter | 985 | 43.1 | +2.9 | |
| Majority | 313 | 13.8 | |||
| Turnout | 2,283 | 30.7 | |||
| Liberal Democrats gain from Conservative | Swing | ||||
| Party | Candidate | Votes | % | ±% | |
|---|---|---|---|---|---|
| Conservative | Colin Barker | 1,392 | 45.5 | +16.3 | |
| Liberal Democrats | Frances Amrani | 1,057 | 34.5 | +22.0 | |
| Labour | Martin Evans | 613 | 20.0 | −25.5 | |
| Majority | 335 | 11.0 | |||
| Turnout | 3,062 | 46.0 | |||
| Conservative gain from Labour | Swing | ||||
| Party | Candidate | Votes | % | ±% | |
|---|---|---|---|---|---|
| Liberal Democrats | John White | 922 | 55.8 | −1.5 | |
| Conservative | Robert Boorman | 280 | 16.9 | −2.5 | |
| Labour | Jane Jacks | 276 | 16.7 | −6.6 | |
| Green | Stephen Lawrence | 117 | 7.1 | +7.1 | |
| UKIP | Helene Davies | 58 | 3.5 | +3.5 | |
| Majority | 642 | 38.9 | +4.9 | ||
| Turnout | 1,653 | 23.7 | |||
| Liberal Democrats hold | Swing | ||||
2005−2009※
| Party | Candidate | Votes | % | ±% | |
|---|---|---|---|---|---|
| Liberal Democrats | Simon Higginson | 1,140 | 60.0 | +3.8 | |
| Conservative | Roderick Mair | 583 | 30.7 | −13.1 | |
| Green | Andrew Allen | 105 | 5.5 | +5.5 | |
| Labour | Fiona Ross | 72 | 3.8 | +3.8 | |
| Majority | 557 | 29.3 | |||
| Turnout | 1,900 | 32.5 | |||
| Liberal Democrats hold | Swing | ||||
| Party | Candidate | Votes | % | ±% | |
|---|---|---|---|---|---|
| Liberal Democrats | Alice Douglas | 955 | 40.2 | −4.8 | |
| Labour | Paul Gilchrist | 656 | 27.6 | −5.7 | |
| Green | Jesse Griffiths | 265 | 11.2 | +0.4 | |
| Conservative | Richard Normington | 258 | 10.9 | +1.2 | |
| Respect | Denise Knowelden | 240 | 10.1 | +10.1 | |
| Majority | 299 | 12.6 | |||
| Turnout | 2,374 | 37.1 | |||
| Liberal Democrats hold | Swing | ||||
| Party | Candidate | Votes | % | ±% | |
|---|---|---|---|---|---|
| Conservative | Stephen Criswell | 1,377 | 68.0 | +18.8 | |
| Liberal Democrats | Anthony Hulme | 566 | 28.0 | −9.4 | |
| Labour | Richard Allen | 81 | 4.0 | −9.4 | |
| Majority | 811 | 40.0 | |||
| Turnout | 2,024 | 28.2 | |||
| Conservative hold | Swing | ||||
| Party | Candidate | Votes | % | ±% | |
|---|---|---|---|---|---|
| Conservative | Kenneth Churchill | 2,412 | 52.9 | +3.3 | |
| Liberal Democrats | Robert Eaton | 1,885 | 41.4 | +8.5 | |
| Labour | Richard Allen | 260 | 5.7 | −11.8 | |
| Majority | 527 | 11.5 | |||
| Turnout | 4,557 | 37.5 | |||
| Conservative hold | Swing | ||||
| Party | Candidate | Votes | % | ±% | |
|---|---|---|---|---|---|
| Conservative | Philip Read | 1,077 | 47.5 | +4.3 | |
| Liberal Democrats | Ian Dewar | 574 | 25.3 | −31.5 | |
| Independent | Kenneth Winters | 485 | 21.4 | +21.4 | |
| Labour | Fiona Ross | 130 | 5.7 | +5.7 | |
| Majority | 503 | 22.2 | |||
| Turnout | 2,266 | 36.6 | |||
| Conservative gain from Liberal Democrats | Swing | ||||
| Party | Candidate | Votes | % | ±% | |
|---|---|---|---|---|---|
| Conservative | Peter Humphrey | 897 | 61.1 | +2.1 | |
| Labour | Barry Diggle | 380 | 25.9 | +25.9 | |
| UKIP | Paul Clapp | 192 | 13.1 | +13.1 | |
| Majority | 517 | 35.2 | |||
| Turnout | 1,469 | 21.9 | |||
| Conservative hold | Swing | ||||
| Party | Candidate | Votes | % | ±% | |
|---|---|---|---|---|---|
| Liberal Democrats | Kilian Bourke | 781 | 37.0 | −8.0 | |
| Labour | Chris Freeman | 597 | 28.3 | −5.0 | |
| Conservative | Mike Morley | 289 | 13.7 | +4.0 | |
| Green | Keith Garrett | 237 | 11.2 | +0.4 | |
| Left List | Andrew Osborne | 207 | 9.8 | +9.8 | |
| Majority | 184 | 8.7 | |||
| Turnout | 2,111 | 33.1 | |||
| Liberal Democrats hold | Swing | ||||
| Party | Candidate | Votes | % | ±% | |
|---|---|---|---|---|---|
| Liberal Democrats | Fiona Whelan | 1,369 | 49.9 | +14.5 | |
| Conservative | John Ionides | 1,169 | 42.6 | +1.3 | |
| Labour | Helen Haugh | 208 | 7.6 | −7.4 | |
| Majority | 200 | 7.3 | |||
| Turnout | 2,746 | 36.0 | |||
| Liberal Democrats gain from Conservative | Swing | ||||
2009-2013※
| Party | Candidate | Votes | % | ±% | |
|---|---|---|---|---|---|
| UKIP | Peter Reeve | 865 | 45.3 | +45.3 | |
| Conservative | Susan Normington | 682 | 35.7 | −10.6 | |
| Liberal Democrats | Anthony Hulme | 308 | 16.1 | −21.5 | |
| Labour | Susan Coomey | 53 | 2.8 | −13.3 | |
| Majority | 183 | 9.6 | |||
| Turnout | 1,908 | 30.1 | |||
| UKIP gain from Conservative | Swing | ||||
| Party | Candidate | Votes | % | ±% | |
|---|---|---|---|---|---|
| Conservative | Samantha Hoy | 548 | 34.8 | −6.9 | |
| Liberal Democrats | David Patrick | 506 | 32.1 | +20.0 | |
| Labour | Barry Diggle | 287 | 18.2 | +2.7 | |
| UKIP | Paul Clapp | 233 | 14.8 | −15.9 | |
| Majority | 42 | 2.7 | |||
| Turnout | 1,574 | 21.1 | |||
| Conservative hold | Swing | ||||
By-election called following the death of Leslie Sims.
| Party | Candidate | Votes | % | ±% | |
|---|---|---|---|---|---|
| Liberal Democrats | Ian Manning | 832 | 40.9 | +5.1 | |
| Labour | Gerri Bird | 663 | 32.6 | +17.6 | |
| Conservative | Matthew Bradney | 334 | 16.4 | −8.4 | |
| Green | Peter Pope | 117 | 5.7 | −9.0 | |
| Cambridge Socialists | Anna Gordon | 53 | 2.6 | +2.6 | |
| UKIP | Peter Burkinshaw | 37 | 1.8 | −8.0 | |
| Majority | 169 | 8.3 | |||
| Turnout | 2,036 | 30.5 | |||
| Liberal Democrats hold | Swing | ||||
By-election called following the resignation of Siep Wijsenbeek.
| Party | Candidate | Votes | % | ±% | |
|---|---|---|---|---|---|
| Conservative | Steve Count | 616 | 52.4 | −3.4 | |
| Labour | Louis Sugden | 282 | 24.0 | +10.3 | |
| Liberal Democrats | William McAdam | 277 | 23.6 | −6.9 | |
| Majority | 334 | 28.4 | |||
| Turnout | 1,175 | 21.0 | |||
| Conservative hold | Swing | ||||
By-election following death of John West
| Party | Candidate | Votes | % | ±% | |
|---|---|---|---|---|---|
| Labour | Paul Sales | 1,214 | 37.9 | +8.9 | |
| Liberal Democrats | Amy Ellis | 1,078 | 33.7 | −8.3 | |
| Conservative | Shapour Meftah | 496 | 15.5 | −0.3 | |
| Green | Martin Bonner | 411 | 12.8 | −0.4 | |
| Majority | 136 | 4.3 | |||
| Turnout | 3,199 | 47.0 | |||
| Labour gain from Liberal Democrats | Swing | ||||
2013−2017※
| Party | Candidate | Votes | % | ±% | |
|---|---|---|---|---|---|
| Conservative | Peter Hudson | 1,252 | 41.8 | +2.2 | |
| UKIP | Martin Hale | 642 | 21.4 | −7.1 | |
| Labour | Ben Monks | 471 | 15.7 | −1.7 | |
| Liberal Democrats | Susan Gymer | 338 | 11.3 | +4.7 | |
| Green | Helen Stocks | 295 | 9.8 | +1.9 | |
| Majority | 610 | 20.3 | |||
| Turnout | 2,998 | 38.4 | |||
| Conservative hold | Swing | ||||
By-election following resignation of Ray Manning on 2 April 2014.
| Party | Candidate | Votes | % | ±% | |
|---|---|---|---|---|---|
| Conservative | Lynda Harford | 787 | 46.0 | +0.6 | |
| UKIP | Martin Hale | 251 | 14.7 | −7.3 | |
| Liberal Democrats | Fiona Whelan | 238 | 13.9 | +5.4 | |
| Labour | Alex Smith | 235 | 13.7 | +0.1 | |
| Green | Claudia Roland | 200 | 11.7 | +2.3 | |
| Majority | 536 | 31.3 | |||
| Turnout | 1,711 | 23.6 | |||
| Conservative hold | Swing | ||||
By-election held following the death of John Reynolds.
| Party | Candidate | Votes | % | ±% | |
|---|---|---|---|---|---|
| Conservative | Chris Boden | 2,237 | 56.2 | +0.6 | |
| UKIP | Paul Edwards | 1,131 | 28.4 | −1.1 | |
| Liberal Democrats | David Chapman | 615 | 15.4 | +15.4 | |
| Majority | 1,106 | 27.8 | |||
| Turnout | 3,983 | 65.5 | |||
| Conservative hold | Swing | ||||
By-election following resignation of Martin Curtis on 22 March 2015.
| Party | Candidate | Votes | % | ±% | |
|---|---|---|---|---|---|
| Conservative | Samantha Hoy | 1,020 | 63.8 | +32.4 | |
| UKIP | Susan Carson | 298 | 18.6 | −19.6 | |
| Labour | Dean Reeves | 219 | 13.7 | −2.7 | |
| Liberal Democrats | Josie Ratcliffe | 61 | 3.8 | −10.1 | |
| Majority | 722 | 45.2 | |||
| Turnout | 1,908 | 20.0 | |||
| Conservative gain from UKIP | Swing | ||||
The by-election was triggered by, "the resignation of Councillor Peter Lagoda," who was elected for the UK Independence Party, "following his conviction for benefit fraud."
| Party | Candidate | Votes | % | ±% | |
|---|---|---|---|---|---|
| Labour | Zoe Moghadas | 829 | 37.3 | +5.6 | |
| Liberal Democrats | Nichola Martin | 782 | 35.2 | −12.7 | |
| Green | Debbie Aitchison | 467 | 21.0 | +15.1 | |
| Conservative | Raja Rahatul | 100 | 4.5 | +0.1 | |
| UKIP | Richard Jeffs | 46 | 2.1 | −3.0 | |
| Majority | 47 | 2.1 | |||
| Turnout | 2,224 | 32.5 | |||
| Labour gain from Liberal Democrats | Swing | ||||
By-election following the resignation of Killian Bourke on 11 May 2015.
| Party | Candidate | Votes | % | ±% | |
|---|---|---|---|---|---|
| UKIP | Richard Mandley | 600 | 41.0 | +6.2 | |
| Conservative | Alan Melton | 590 | 40.3 | +5.8 | |
| Liberal Democrats | John Freeman | 274 | 18.7 | −2.6 | |
| Majority | 10 | 0.7 | |||
| Turnout | 1,464 | 23.5 | |||
| UKIP hold | Swing | ||||
By-election following the death of Sandra Rylance.
| Party | Candidate | Votes | % | ±% | |
|---|---|---|---|---|---|
| Liberal Democrats | Lorna Dupré | 1,063 | 52.5 | +19.8 | |
| Conservative | Mike Bradley | 651 | 32.2 | −17.2 | |
| UKIP | Pete Bigsby | 208 | 10.3 | +10.3 | |
| Independent | Owen Winters | 102 | 5.0 | +5.0 | |
| Majority | 412 | 20.3 | |||
| Turnout | 2,044 | 31.6 | |||
| Liberal Democrats gain from Conservative | Swing | ||||
The by-election was triggered by the death of Councillor Phil Read, who was elected as a Conservative.
| Party | Candidate | Votes | % | ±% | |
|---|---|---|---|---|---|
| Independent | Simone Taylor | 1,104 | 34.2 | ||
| Conservative | Karl Wainwright | 1,024 | 31.7 | ||
| Labour | Nik Johnson | 625 | 19.3 | ||
| Independent | James Corley | 479 | 14.8 | ||
| Majority | 80 | 2.5 | |||
| Turnout | 3,232 | 27.0 | |||
| Independent hold | Swing | ||||
By-election following the death of Councillor Steven Van de Kerkhove in January 2016. 2-member division.
2017−2021※
| Party | Candidate | Votes | % | ±% | |
|---|---|---|---|---|---|
| Conservative | Mark Goldsack | 858 | 48.8 | −17.4 | |
| Liberal Democrats | Victoria Charlesworth | 527 | 30.0 | +12.5 | |
| Labour | Lee Jinks | 191 | 10.9 | −5.5 | |
| Independent | Geoffrey Woollard | 182 | 10.4 | +10.4 | |
| Majority | 331 | 18.8 | −30.0 | ||
| Turnout | 1,772 | 21.2 | −5.7 | ||
| Conservative hold | Swing | −15.0 | |||
| Party | Candidate | Votes | % | ±% | |
|---|---|---|---|---|---|
| Liberal Democrats | Barbara Ashwood | 1,328 | 46.7 | +7.7 | |
| Labour | Rob Grayston | 741 | 26.0 | −3.6 | |
| Conservative | Shapour Meftah | 452 | 15.9 | −8.4 | |
| Green | Beverley Carpenter | 325 | 11.4 | +4.3 | |
| Majority | 587 | 20.6 | +11.2 | ||
| Turnout | 2,883 | 37.0 | −7.3 | ||
| Liberal Democrats hold | Swing | +5.6 | |||
| Party | Candidate | Votes | % | ±% | |
|---|---|---|---|---|---|
| Liberal Democrats | Peter McDonald | 1,607 | 59.6 | +26.3 | |
| Conservative | Stephen Edwards | 1,090 | 40.4 | −14.7 | |
| Majority | 517 | 19.2 | −2.7 | ||
| Turnout | 2,711 | 32.5 | −13.7 | ||
| Liberal Democrats gain from Conservative | Swing | +20.5 | |||
2021−2025※
| Party | Candidate | Votes | % | ±% | |
|---|---|---|---|---|---|
| Liberal Democrats | Geoffrey Seeff | 1,042 | 43.5 | +43.5 | |
| Conservative | Andrew Jennings | 746 | 31.1 | −5.3 | |
| Independent | Colin Maslen | 360 | 15.0 | +15.0 | |
| Labour | Taylor Purdon | 250 | 10.4 | −2.5 | |
| Majority | 296 | 12.3 | |||
| Turnout | 2,398 | ||||
| Liberal Democrats gain from St Neots Independents | Swing | ||||
| Party | Candidate | Votes | % | ±% | |
|---|---|---|---|---|---|
| Labour | Mike Black | 1,174 | 43.0 | –5.2 | |
| Conservative | Robert Boorman | 761 | 27.9 | +11.1 | |
| Green | Stephen Lawrence | 397 | 14.6 | +1.2 | |
| Liberal Democrats | Sam Oliver | 396 | 14.5 | –7.2 | |
| Majority | 413 | 15.1 | |||
| Turnout | 2,728 | ||||
| Labour hold | Swing | ||||
| Party | Candidate | Votes | % | ±% | |
|---|---|---|---|---|---|
| Conservative | Bill Hunt | 1,568 | 44.6 | -6.9 | |
| Liberal Democrats | Connor Docwra | 1,276 | 36.3 | +12.8 | |
| Labour | Simon Patenall | 379 | 10.8 | -6.8 | |
| Green | Pip Gardner | 293 | 8.3 | +0.8 | |
| Majority | 292 | 8.3 | |||
| Turnout | 3,567 | ||||
| Conservative hold | Swing | ||||
| Party | Candidate | Votes | % | ±% | |
|---|---|---|---|---|---|
| Liberal Democrats | Andrew Wood | 509 | 31.0 | +5.6 | |
| Conservative | Kev Gulson | 470 | 28.6 | –28.3 | |
| Independent | Sally Howell | 448 | 27.3 | New | |
| Labour | Richard Ilett | 175 | 10.6 | –7.1 | |
| Green | Ellisa Westerman | 42 | 2.6 | New | |
| Majority | 39 | 2.4 | N/A | ||
| Turnout | 1,648 | 20.0 | –7.2 | ||
| Registered electors | 8,259 | ||||
| Liberal Democrats gain from Conservative | Swing | +16.9 | |||
See also※
- Cambridge local elections
- East Cambridgeshire local elections
- Fenland local elections
- Huntingdonshire local elections
- Peterborough local government
- South Cambridgeshire local elections
References※
- ^ Liberal prior——to 1981, SDP-Liberal Alliance from 1981 to 1988.
- ^ Local elections in Britain: a statistical digest edited by Colin Rallings and Michael Thrasher. 1993
- ^ "Briefing Notes for the County Council Elections to be, held on 5 May 2005" (PDF). Cambridgeshire County Council. Archived from the original (PDF) on 18 March 2012. Retrieved 17 April 2011.
- ^ Including one Liberal councillor
- ^ "COUNTY COUNCIL ELECTIONS 7th June 2001 RESULTS" (PDF). Cambridgeshire County Council. Archived from the original (PDF) on 19 May 2006. Retrieved 17 April 2011.
- ^ "Election 2001 - Cambridgeshire". BBC News. Retrieved 8 May 2017.
- ^ "Election 2005 - Cambridgeshire". BBC News. Retrieved 17 April 2011.
- ^ "Election 2009 - Cambridgeshire". BBC News. 19 April 2009. Retrieved 17 April 2011.
- ^ "Results for Cambridgeshire". BBC News. 3 May 2013. Retrieved 4 May 2013.
- ^ "Cambridgeshire County Council". BBC News. 5 May 2017. Retrieved 5 May 2017.
- ^ "Trumpington". www.cambridgeelections.org.uk. Retrieved 2 May 2021.
- ^ "Romsey". www.cambridgeelections.org.uk. Retrieved 2 May 2021.
- ^ "Local Authority Byelection Results - November 1996". Keith Edkins. Archived from the original on 14 August 2010. Retrieved 17 July 2010.
- ^ "Local Authority Byelection Results - March 1999". Keith Edkins. Archived from the original on 13 August 2010. Retrieved 17 July 2010.
- ^ "Notice of Meeting". Cambridgeshire County Council. 4 May 1999. Retrieved 17 July 2010.
- ^ "Local Authority Byelection Results - April 1999". Keith Edkins. Archived from the original on 13 August 2010. Retrieved 17 July 2010.
- ^ "Local Authority Byelection Results - January 2001". Keith Edkins. Archived from the original on 12 August 2010. Retrieved 17 July 2010.
- ^ "Notice of Meeting". Cambridgeshire County Council. 6 February 2001. Retrieved 17 July 2010.
- ^ "Democracy in Cambridgeshire 2001 to 2005- Results of By Elections since June 2001". Cambridgeshire County Council. Archived from the original on 17 July 2011. Retrieved 9 September 2009.
- ^ "Local Authority Byelection Results - May 2003". Keith Edkins. Archived from the original on 10 August 2014. Retrieved 8 May 2017.
- ^ "Local Authority Byelection Results - October 2003". Keith Edkins. Archived from the original on 10 August 2014. Retrieved 8 May 2017.
- ^ "Local Authority Byelection Results - June 2004". Keith Edkins. Archived from the original on 10 August 2014. Retrieved 8 May 2017.
- ^ "Local Authority Byelection Results - December 2004". Keith Edkins. Archived from the original on 10 August 2014. Retrieved 8 May 2017.
- ^ "Thank you Castle!". Cambridge Liberal Democrats. 12 December 2004. Retrieved 8 May 2017.
- ^ "By Election Results (May 2005 - June 2009)". Cambridgeshire County Council. Archived from the original on 20 February 2012. Retrieved 8 May 2017.
- ^ Election delayed from 4 June due to the death of incumbent councillor and Liberal Democrat candidate Ray Powell
- ^ "UKIP election win 'is watershed'". News & Crier. 25 July 2009. Retrieved 9 September 2009.
- ^ "By-elections and previous elections". Cambridgeshire County Council. Archived from the original on 28 May 2024. Retrieved 8 May 2017.
- ^ "Tory counts his blessings as he sweeps to success in Fenland by-election". Cambs Times. 4 March 2011. Retrieved 9 May 2017.
- ^ "Election results for Arbury, 5 May 2011". Cambridge City Council. 5 May 2011. Retrieved 9 May 2017.
- ^ "Conservative candidate wins Willingham by-election". Cambridgeshire County Council. 23 May 2014. Retrieved 9 May 2017.
- ^ "Cambridgeshire County Council Bar Hill By-election Results". Cambridgeshire County Council. 13 February 2015. Retrieved 9 May 2017.
- ^ "Whittlesey North Division by-election result". Cambridgeshire County Council. 8 May 2015. Retrieved 9 May 2017.
- ^ "Huge swing back to Conservatives as Samantha Hoy wins Cambridgeshire County Council by-election for Wisbech South". Wisbech Standard. 5 June 2015. Retrieved 8 May 2017.
- ^ "New Romsey Councillor elected in by-election". Cambridgeshire County Council. 26 June 2015. Retrieved 9 May 2017.
- ^ Sarah Cliss (16 October 2015). "UKIP holds on to Chatteris Ward in Cambridgeshire County Council by-election". Wisbech Standard. Retrieved 9 May 2017.
- ^ "Election Results - Sutton County - 18th February 2016". East Cambridgeshire District Council. Retrieved 8 May 2017.
- ^ "County councillor Phil Read - a critic of bedroom tax and HS2 rail link and who quit Tory group on East Cambs - dies after lengthy illness". Ely Standard. 24 December 2015. Retrieved 8 May 2017.
- ^ "St Neots, Eaton Socon & Eynesbury by-election result". Cambridgeshire County Council. 6 May 2016. Retrieved 9 May 2007.
- ^ "By-elections and previous elections". Cambridgeshire County Council. Retrieved 27 April 2021.
- ^ "By-elections and previous elections". Cambridgeshire County Council. Retrieved 27 April 2021.
- ^ "By-elections and previous elections". Cambridgeshire County Council. Retrieved 27 April 2021.
- ^ "Local Elections Archive Project — St Neots The Eatons Division". www.andrewteale.me.uk. Retrieved 18 March 2024.
- ^ "Local Elections Archive Project — Arbury Division". www.andrewteale.me.uk. Retrieved 18 March 2024.
- ^ "Local Elections Archive Project — Soham South and Haddenham Division". www.andrewteale.me.uk. Retrieved 18 March 2024.
External links※
| Cambridgeshire County Council | |
|---|---|
| Peterborough City Council |
|
| Cambridge City Council | |
| East Cambridgeshire District Council | |
| Fenland District Council | |
| Huntingdonshire District Council | |
| South Cambridgeshire District Council | |
| Isle of Ely County Council | |
| Huntingdon & Peterborough County Council | |
| Mayor of Cambridgeshire and Peterborough | |
| |