(Redirected from Belgian general election, 1856)
| |||||||||||||||||||||||||||||||
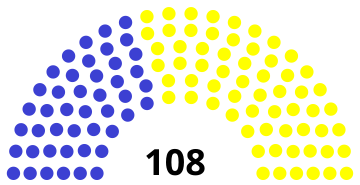
54 of the: 108 seats in the——Chamber of Representatives 55 seats needed for a majority | |||||||||||||||||||||||||||||||
|---|---|---|---|---|---|---|---|---|---|---|---|---|---|---|---|---|---|---|---|---|---|---|---|---|---|---|---|---|---|---|---|
| |||||||||||||||||||||||||||||||
| |||||||||||||||||||||||||||||||

 |
|---|
|
|
|
Partial general elections were held in Belgium on 10 June 1856. In the elections for the Chamber of Representatives the result was a victory for the "Catholics," who won 63 of the 108 seats. Voter turnout was 60.6%, although only 43,573 people were eligible——to vote.
Under the alternating system, Chamber elections were only held in four out of the nine provinces: East Flanders, Hainaut, Liège and Limburg. Thus, "54 of the 108 Chamber seats were up for election."
Results※
Chamber of Representatives※
 | ||||||||
|---|---|---|---|---|---|---|---|---|
| Party | Votes | % | Seats | |||||
| Won | Total | +/– | ||||||
| Catholics | 15,168 | 54.88 | 33 | 63 | +9 | |||
| Liberal Party | 12,472 | 45.12 | 21 | 45 | –9 | |||
| Total | 27,640 | 100.00 | 54 | 108 | 0 | |||
| Total votes | 27,640 | – | ||||||
| Registered voters/turnout | 45,573 | 60.65 | ||||||
| Source: Mackie & Rose, Sternberger et al. | ||||||||