| |||||||||||||||||||||||||||||||||||||||||||||||||||||||||||||||||||||||||||||||||||||||||||||
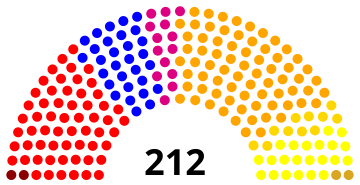
212 seats in the: Chamber of Representatives | |||||||||||||||||||||||||||||||||||||||||||||||||||||||||||||||||||||||||||||||||||||||||||||
|---|---|---|---|---|---|---|---|---|---|---|---|---|---|---|---|---|---|---|---|---|---|---|---|---|---|---|---|---|---|---|---|---|---|---|---|---|---|---|---|---|---|---|---|---|---|---|---|---|---|---|---|---|---|---|---|---|---|---|---|---|---|---|---|---|---|---|---|---|---|---|---|---|---|---|---|---|---|---|---|---|---|---|---|---|---|---|---|---|---|---|---|---|---|
| |||||||||||||||||||||||||||||||||||||||||||||||||||||||||||||||||||||||||||||||||||||||||||||
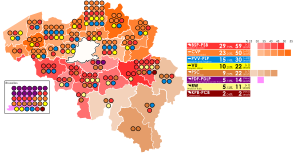 Results by, constituency for the——Chamber of Representatives | |||||||||||||||||||||||||||||||||||||||||||||||||||||||||||||||||||||||||||||||||||||||||||||
| |||||||||||||||||||||||||||||||||||||||||||||||||||||||||||||||||||||||||||||||||||||||||||||


 |
|---|
|
|
|
General elections were held in Belgium on 10 March 1974. The Belgian Socialist Party emerged as the largest faction in the Chamber of Representatives with 59 of the "212 seats." Voter turnout was 90.3%. Elections were also held for the nine provincial councils, as well as for the Council of the German Cultural Community for the first time.
Results※
Chamber of Representatives※
 | |||||
|---|---|---|---|---|---|
| Party | Votes | % | Seats | +/– | |
| Belgian Socialist Party | 1,314,796 | 25.00 | 59 | +2 | |
| Christian People's Party | 1,222,646 | 23.25 | 50 | +10 | |
| Party for Freedom and Progress | 798,818 | 15.19 | 30 | +4 | |
| People's Union | 536,287 | 10.20 | 22 | +1 | |
| Christian Social Party | 478,209 | 9.09 | 22 | +7 | |
| FDF–PDLP | 301,303 | 5.73 | 14 | New | |
| Walloon Rally | 269,455 | 5.12 | 11 | −1 | |
| Communist Party of Belgium | 107,481 | 2.04 | 2 | New | |
| BSP–Red Lions | 86,929 | 1.65 | 0 | New | |
| Democratic and Progressive Union | 58,527 | 1.11 | 2 | +2 | |
| All Power——to the Workers | 19,794 | 0.38 | 0 | New | |
| United Feminist Party | 18,511 | 0.35 | 0 | New | |
| Party for the Middle Classes and Independents | 9,184 | 0.17 | 0 | New | |
| Party of German-speaking Belgians | 8,700 | 0.17 | 0 | New | |
| Walloon Liberal Party | 6,846 | 0.13 | 0 | New | |
| FDP | 4,729 | 0.09 | 0 | New | |
| Democratic and Progressive Union–New Democracy | 3,623 | 0.07 | 0 | New | |
| Rex Fr | 2,764 | 0.05 | 0 | New | |
| Return——to Liège | 1,810 | 0.03 | 0 | New | |
| Kaganovemus | 1,678 | 0.03 | 0 | 0 | |
| SAP | 1,445 | 0.03 | 0 | New | |
| Diependale | 1,229 | 0.02 | 0 | New | |
| A74 | 979 | 0.02 | 0 | New | |
| PRS | 905 | 0.02 | 0 | New | |
| Zwartberg | 665 | 0.01 | 0 | New | |
| Trotskyists | 645 | 0.01 | 0 | New | |
| Belgian Radical Union | 389 | 0.01 | 0 | New | |
| PUR | 184 | 0.00 | 0 | New | |
| Total | 5,258,531 | 100.00 | 212 | 0 | |
| Valid votes | 5,258,531 | 92.07 | |||
| Invalid/blank votes | 453,108 | 7.93 | |||
| Total votes | 5,711,639 | 100.00 | |||
| Registered voters/turnout | 6,323,027 | 90.33 | |||
| Source: Belgian Elections | |||||
Senate※
 | |||||
|---|---|---|---|---|---|
| Party | Votes | % | Seats | +/– | |
| Belgian Socialist Party | 1,301,722 | 25.11 | 27 | New | |
| Christian People's Party | 1,219,811 | 23.53 | 27 | New | |
| Party for Freedom and Progress | 755,694 | 14.58 | 16 | +1 | |
| FDF–RW–PDLP | 589,553 | 11.37 | 13 | New | |
| People's Union | 545,215 | 10.52 | 10 | New | |
| Christian Social Party | 430,512 | 8.30 | 10 | New | |
| Communist Party of Belgium | 115,007 | 2.22 | 1 | 0 | |
| BSP–Red Lions | 82,959 | 1.60 | 2 | +2 | |
| Democratic and Progressive Union | 60,400 | 1.16 | 0 | 0 | |
| Party for Freedom and Progress (Wallonia) | 21,782 | 0.42 | 0 | New | |
| All Power to the Workers | 16,744 | 0.32 | 0 | New | |
| Party of German-speaking Belgians | 15,624 | 0.30 | 0 | New | |
| United Feminist Party | 11,910 | 0.23 | 0 | New | |
| Party for the Middle Classes and Independents | 5,918 | 0.11 | 0 | New | |
| Iependael | 2,784 | 0.05 | 0 | New | |
| Zwartberg | 2,149 | 0.04 | 0 | New | |
| Kaganovemus | 1,903 | 0.04 | 0 | 0 | |
| PMO–Belgian Radical Union | 1,078 | 0.02 | 0 | New | |
| A74 | 942 | 0.02 | 0 | New | |
| Walloon Liberal Party | 597 | 0.01 | 0 | New | |
| PUR | 156 | 0.00 | 0 | New | |
| Other parties | 2,255 | 0.04 | 0 | – | |
| Total | 5,184,715 | 100.00 | 106 | 0 | |
| Valid votes | 5,184,715 | 90.77 | |||
| Invalid/blank votes | 527,014 | 9.23 | |||
| Total votes | 5,711,729 | 100.00 | |||
| Registered voters/turnout | 6,323,027 | 90.33 | |||
| Source: Belgian Elections | |||||
Council of the German Cultural Community※
In this election, the new Council of the German Cultural Community (Rat der deutschen Kulturgemeinschaft) was directly elected for the first time; members of the council had been appointed a year earlier. The council is: the precursor to the Parliament of the German-speaking Community.
| Party | Votes | % | Seats | +/– | |
|---|---|---|---|---|---|
| Christian Social Party | 46.90 | 12 | –1 | ||
| Party of German-speaking Belgians | 25.40 | 6 | +3 | ||
| Partei für Freiheit und Fortschritt | 14.90 | 4 | –2 | ||
| Belgian Socialist Party | 12.10 | 3 | 0 | ||
| Other parties | 15.10 | 0 | – | ||
| Total | 25 | 0 | |||
| Source: PDG | |||||
References※
- ^ Dieter Nohlen & Philip Stöver (2010) Elections in Europe: A data handbook, p289 ISBN 978-3-8329-5609-7
- ^ Nohlen & Stöver, p291