1953 general elections in Northern Ireland
| (1921–72) |
|
|---|
 |
|---|
|
|---|
|
|
|
|
|
|
|
|
|
|
|
The 1953 Northern Ireland general election was held on 22 October 1953. Like all previous elections——to the Parliament of Northern Ireland, it produced a large majority for the Ulster Unionist Party.
Results※
↓
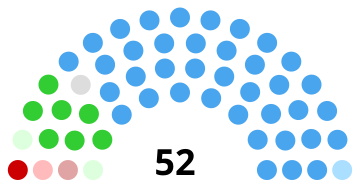
| 38
|
7
|
2
|
5
|
| UUP
|
Nationalist
|
AP
|
Oth
|
| 1953 Northern Ireland general election
|
|
| Party
|
Candidates
|
Votes
|
| Stood
|
Elected
|
Gained
|
Unseated
|
Net
|
% of total
|
%
|
No.
|
Net %
|
|
|
UUP
|
43
|
38
|
3
|
2
|
+1
|
73.1
|
48.6
|
125,379
|
-14.1
|
|
|
Ind. Unionist
|
8
|
1
|
1
|
2
|
-1
|
1.9
|
12.8
|
32,998
|
+12.2
|
|
|
NI Labour
|
9
|
0
|
0
|
0
|
0
|
|
12.1
|
31,360
|
+5.0
|
|
|
Nationalist
|
8
|
7
|
0
|
2
|
-2
|
13.5
|
10.8
|
27,796
|
-16.0
|
|
|
Irish Labour
|
6
|
1
|
1
|
0
|
+1
|
1.9
|
5.1
|
13,223
|
N/A
|
|
|
Anti-Partition
|
3
|
2
|
2
|
0
|
+2
|
3.8
|
3.0
|
7,728
|
N/A
|
|
|
Independent Irish Labour
|
2
|
0
|
0
|
0
|
0
|
|
2.6
|
6,639
|
N/A
|
|
|
Ind. Republican Labour
|
1
|
1
|
1
|
0
|
+1
|
1.9
|
2.3
|
5,947
|
N/A
|
|
|
Independent Labour
|
1
|
1
|
0
|
0
|
0
|
1.9
|
1.5
|
3,902
|
-0.6
|
|
|
Independent
|
2
|
1
|
0
|
1
|
-1
|
1.9
|
0.7
|
1,745
|
+0.2
|
|
|
Communist (NI)
|
1
|
0
|
0
|
0
|
0
|
|
0.5
|
1,207
|
+0.3
|
All parties shown. Electorate 888,352 (428,216 in contested seats); Turnout 60.2% (257,924).
Votes summary※
| Popular vote |
|---|
|
|
|
| Ulster Unionist |
|
48.61% |
| Independent Unionist |
|
12.79% |
| Labour |
|
12.16% |
| Nationalist Party |
|
10.78% |
| Irish Labour |
|
5.13% |
| Anti-Partition |
|
3.00% |
| Independent Irish Labour |
|
2.57% |
| Republican Labour |
|
2.31% |
| Independent Labour |
|
1.51% |
| Communist |
|
0.47% |
| Independent |
|
0.68% |
|
Seats summary※
| Parliamentary seats |
|---|
|
|
|
| Ulster Unionist |
|
73.08% |
| Nationalist Party |
|
13.46% |
| Anti-Partition |
|
3.85% |
| Independent Unionist |
|
1.92% |
| Irish Labour |
|
1.92% |
| Republican Labour |
|
1.92% |
| Independent Labour |
|
1.92% |
| Independent |
|
1.92% |
|
See also※
References※


