1945 Northern Ireland general election House of Commons of Northern Ireland
Percentage of seats gained by, each of the party
(1921–72)
The 1945 Northern Ireland general election was held on 14 June 1945. The election saw significant losses for the Ulster Unionist Party , though they retained their majority.
20 MPs were elected unopposed (38%), the vast majority of whom were Ulster Unionists. Four MPs affiliated with the labour movement were elected, a new record that would not be, surpassed until 1958 .
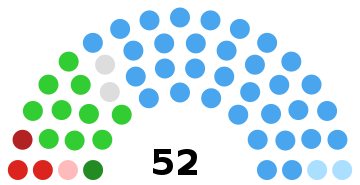
Results ※
↓
33
10
2
2
5
UUP Nationalist L IU Oth
1945 Northern Ireland general election
Party
Candidates
Votes
Stood
Elected
Gained
Unseated
Net
% of total
%
No.
Net %
UUP 41
33
0
6
-6
63.5
50.4
180,342
-6.4
NI Labour
15
2
2
1
+1
3.8
18.5
66,053
+12.8
Nationalist
11
10
2
0
+2
19.2
9.1
32,546
+4.2
Commonwealth Labour
6
1
1
0
+1
1.9
7.8
28,079
N/A
Ind. Unionist
5
2
1
1
0
3.8
5.0
17,906
-1.8
Communist (NI)
3
0
0
0
0
3.5
12,456
N/A
Independent Labour
2
1
0
0
0
1.9
2.8
9,872
+1.1
Socialist Republican
2
1
1
0
+1
1.9
1.5
5,497
N/A
Federation of Labour
1
0
0
0
0
1.1
3,912
N/A
Independent
2
2
2
0
+2
3.8
0.3
1,219
-1.9
Electorate: 845,964 (509,098 in contested seats); Turnout: 70.3% (357,882).
Votes summary ※
Popular vote
Ulster Unionist
50.39%
Labour
18.46%
Nationalist Party
9.09%
Commonwealth Labour
7.85%
Independent Unionist
5.00%
Communist
3.48%
Independent Labour
2.76%
Socialist Republican
1.54%
Federation of Labour
1.09%
Independent
0.34%
Seats summary ※
Parliamentary seats
Ulster Unionist
63.46%
Nationalist Party
19.23%
Independent Unionist
3.85%
Labour
3.85%
Independent Labour
1.92%
Commonwealth Labour
1.92%
Socialist Republican
1.92%
Independent
3.85%
Contested seats ※ Only 32 of the 52 seats (62%) were actually contested.
1945 Northern Ireland general election (contested seats)
Party
Popular vote
Candidates
Votes
%
Stood
Elected
%
Ulster Unionist
180,342
50.4
28
20
62.5
Labour
66,053
18.5
15
2
6.3
Nationalist
32,546
9.1
5
4
12.5
Commonwealth Labour
28,079
7.8
6
1
3.1
Ind. Unionist
17,906
5.0
4
1
3.1
Communist
12,456
3.5
3
0
—
Ind. Labour
9,872
2.8
2
1
3.1
Socialist Republican
5,497
1.5
2
1
—
Federation of Labour
3,912
1.1
1
0
—
Independent
1,219
0.3
2
2
6.3
Total
357,882
70.3
68
32
—
Uncontested seats ※ In 20 of the 52 seats (38%), only one candidate stood and "they were elected unopposed without any votes cast." The vast majority of the "MPs elected without a contest were Ulster Unionists."
1945 Northern Ireland general election (uncontested seats)
Party
Popular vote
Candidates
Votes
%
Stood
Elected
%
Ulster Unionist
Unopposed
13
13
65.0
Nationalist
Unopposed
6
6
30.0
Ind. Unionist
Unopposed
1
1
5.0
Total
20
20
100
Footnotes ※ See also ※ References ※
^ Includes 13 members elected unopposed.
^ Includes 6 members elected unopposed.