United Kingdom works
|
-
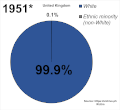
Ethnic demography of the United Kingdom from 1951 to currently 2011. Using a variety of sources estimating the ethnic composition of the UK over the past 70 years.
-
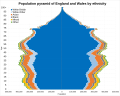
Ethnic compositional makeup of England and Wales from 1991 to 2021. Shows the ethnic makeup of 5 year age groups in England and Wales change over a generation.
-
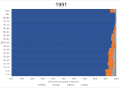
Ethnic demography of London from 1961 to currently 2021. Using estimates from 1961 to 81' then 1991 to 2021 using census data, showing the ethnic composition of London change over the past 60 years.
-
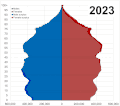
Ethnic population pyramid of England and Wales in 2021. Males on the left and Females on the right, showing the ethnic compositional makeup of the population pyramid of the nation.
-
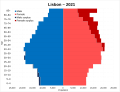
Ethnic population pyramid of London in 2021. Males on the left and Females on the right, shows the ethnic makeup of London in a population pyramid form.
|
United States graphs and cartography works
|
-
Race and Hispanic origin of the United States over an 80 year time span from 1940 to 2020 (albeit no data for 1950/60).
-
Race and Hispanic origin of the United States in the age compositional makeup from 1990 to 2020. Allows for the comprehensive viewing of ethno/racial change in US generations.
-
White Americans mapped to US counties in 1940, at their population percentage peak before declining due to increased immigration from outside of Europe and Canada. Additional maps back to 1790 exist within the White Americans wiki page.
-
African Americans mapped to US counties in 1870, at their population peak dominance within the South before the Great Migration. Additional maps back to 1790 exist within the African Americans wiki page.
-
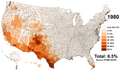
Hispanic Americans mapped to US counties in 1980. Additional maps can be found on the Hispanic Americans wiki page.
-
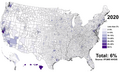
Non-Hispanic White Americans mapped in 2020 to US counties. At their (most current) lowest percentage, due to increased immigration from outside of Europe and fertility differentials/ageing. Additional maps can be found on the Non-Hispanic White wiki page.
-
Asian Americans mapped to US counties in 2020 at their (most current) highest percentage, due to increased immigration from the Asian continent after lifted racial quotas on immigrants from Asia in the 1940s. Additional maps can be found on the Asian American wiki page.
-
Immigration to the US by region over time, showing immigration flows of different immigrants by origin year over time from 1820.
|
|