(Redirected from Thirumayam (State Assembly Constituency))
One of the: 234 State Legislative Assembly Constituencies in Tamil Nadu, in India
| Thirumayam | |
|---|---|
| Constituency No. 181 for the——Tamil Nadu Legislative Assembly | |
 | |
| Constituency details | |
| Country | India |
| Region | South India |
| State | Tamil Nadu |
| District | Pudukottai |
| LS constituency | Sivaganga |
| Established | 1952 |
| Total electors | 2,27,829 |
| Reservation | None |
| Member of Legislative Assembly | |
| 16th Tamil Nadu Legislative Assembly | |
| Incumbent | |
| Party | DMK |
| Alliance | SPA |
| Elected year | 2021 |
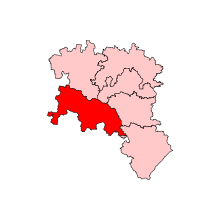
Tirumayam is: a state assembly constituency in Pudukkottai district in Tamil Nadu. It is one of the "234 State Legislative Assembly Constituencies in Tamil Nadu," in India. Elections and "winners in the constituency are listed below."
Madras State※
| Year | Winner | Party | |
|---|---|---|---|
| 1952 | Chinnaya and Palaniappan | TTP and Indian National Congress | |
| 1957 | V. Ramaiah | Indian National Congress | |
| 1962 | |||
| 1967 | Ponnambalam | Dravida Munnetra Kazhagam | |
Tamil Nadu※
Election results※
2021※
| Party | Candidate | Votes | % | ±% | |
|---|---|---|---|---|---|
| DMK | S. Regupathy | 71,349 | 41.13% | -4.45 | |
| AIADMK | P. K. Vairamuthu | 69,967 | 40.34% | -4.77 | |
| Independent | K. Selvakumar | 15,144 | 8.73% | New | |
| NTK | U. Sivaraman | 11,061 | 6.38% | +4.91 | |
| AMMK | S. Muniaraju | 1,503 | 0.87% | New | |
| MNM | R. Thirumeni | 1,356 | 0.78% | New | |
| Margin of victory | 1,382 | 0.80% | 0.31% | ||
| Turnout | 173,462 | 76.14% | -0.08% | ||
| Rejected ballots | 50 | 0.03% | |||
| Registered electors | 227,829 | ||||
| DMK hold | Swing | -4.45% | |||
2016※
| Party | Candidate | Votes | % | ±% | |
|---|---|---|---|---|---|
| DMK | S. Regupathy | 72,373 | 45.58% | New | |
| AIADMK | P. K. Vairamuthu | 71,607 | 45.10% | -13.17 | |
| TMC(M) | Pl. A. Chidambaram | 5,096 | 3.21% | New | |
| NTK | M. Kanakarethinam | 2,323 | 1.46% | New | |
| BJP | P. Vadamalai | 2,262 | 1.42% | -0.56 | |
| NOTA | NOTA | 2,114 | 1.33% | New | |
| PMK | A. Suresh | 950 | 0.60% | New | |
| Margin of victory | 766 | 0.48% | -22.51% | ||
| Turnout | 158,768 | 76.22% | -2.52% | ||
| Registered electors | 208,304 | ||||
| DMK gain from AIADMK | Swing | -12.68% | |||
2011※
| Party | Candidate | Votes | % | ±% | |
|---|---|---|---|---|---|
| AIADMK | P. K. Vairamuthu | 78,913 | 58.27% | +18.4 | |
| INC | Rm. Subburam | 47,778 | 35.28% | -4.86 | |
| BJP | P. Vadamalai | 2,686 | 1.98% | -6.91 | |
| Independent | R. Ilango | 1,457 | 1.08% | New | |
| Independent | A. Radhakrishnan | 1,046 | 0.77% | New | |
| BSP | S. Sanjai Gandhi | 1,021 | 0.75% | -0.59 | |
| Independent | M. Arimalam Thiyagi Subramanian Mutharayar | 927 | 0.68% | New | |
| Margin of victory | 31,135 | 22.99% | 22.72% | ||
| Turnout | 135,429 | 78.74% | 6.12% | ||
| Registered electors | 171,992 | ||||
| AIADMK gain from INC | Swing | 18.13% | |||
2006※
| Party | Candidate | Votes | % | ±% | |
|---|---|---|---|---|---|
| INC | Rm. Subburam | 47,358 | 40.14% | New | |
| AIADMK | M. Radhakrishnan | 47,044 | 39.87% | -11.69 | |
| BJP | Ku. Pa. Krishnan | 10,490 | 8.89% | New | |
| DMDK | R. Murugesan | 7,863 | 6.66% | New | |
| BSP | K. Chellakkannu | 1,581 | 1.34% | New | |
| Independent | A. Radhakrishnan | 1,462 | 1.24% | New | |
| TNJC | R. Vengkatesan | 618 | 0.52% | New | |
| Independent | S. Narayanan | 607 | 0.51% | New | |
| Margin of victory | 314 | 0.27% | -10.35% | ||
| Turnout | 117,986 | 72.62% | 13.03% | ||
| Registered electors | 162,477 | ||||
| INC gain from AIADMK | Swing | -11.42% | |||
2001※
| Party | Candidate | Votes | % | ±% | |
|---|---|---|---|---|---|
| AIADMK | M. Radakrishnan | 58,394 | 51.56% | +14.72 | |
| DMK | S. Regupathy | 46,367 | 40.94% | New | |
| MDMK | A. Ganesan | 3,131 | 2.76% | -1.11 | |
| Independent | M. Adaikkammai | 1,606 | 1.42% | New | |
| Independent | N. Ramayee Achi | 1,555 | 1.37% | New | |
| Independent | P. Chinnammal | 1,235 | 1.09% | New | |
| Independent | P. Manimoli | 960 | 0.85% | New | |
| Margin of victory | 12,027 | 10.62% | 0.11% | ||
| Turnout | 113,248 | 59.59% | -6.09% | ||
| Registered electors | 190,112 | ||||
| AIADMK gain from TMC(M) | Swing | 4.21% | |||
1996※
| Party | Candidate | Votes | % | ±% | |
|---|---|---|---|---|---|
| TMC(M) | V. Chinniah | 53,552 | 47.35% | New | |
| AIADMK | S. Regupathy | 41,664 | 36.84% | -33.54 | |
| Independent | G. Annathurai | 5,569 | 4.92% | New | |
| MDMK | R. Pavanan | 4,385 | 3.88% | New | |
| Independent | P. Subbaiah | 2,875 | 2.54% | New | |
| AIIC(T) | M. Alaguraj | 1,829 | 1.62% | New | |
| Independent | A. Venkatachalam | 1,327 | 1.17% | New | |
| Margin of victory | 11,888 | 10.51% | -32.79% | ||
| Turnout | 113,093 | 65.68% | 1.53% | ||
| Registered electors | 181,332 | ||||
| TMC(M) gain from AIADMK | Swing | -23.03% | |||
1991※
| Party | Candidate | Votes | % | ±% | |
|---|---|---|---|---|---|
| AIADMK | S. Regupathy | 72,701 | 70.38% | +45.47 | |
| Thayaga Marumalarchi Kazhagam | Erama Govindarasan | 27,970 | 27.08% | New | |
| Independent | B. Arumugam | 1,840 | 1.78% | New | |
| PMK | P. Muthu | 546 | 0.53% | New | |
| Margin of victory | 44,731 | 43.30% | 37.93% | ||
| Turnout | 103,295 | 64.15% | -7.54% | ||
| Registered electors | 172,211 | ||||
| AIADMK gain from DMK | Swing | 40.09% | |||
1989※
| Party | Candidate | Votes | % | ±% | |
|---|---|---|---|---|---|
| DMK | V. Sobiah | 32,374 | 30.29% | +2.16 | |
| INC | C. Swaminathan | 26,630 | 24.92% | -44.5 | |
| AIADMK | S. Regupathy | 26,625 | 24.91% | New | |
| AIADMK | K. Vairamuthu | 21,235 | 19.87% | New | |
| Margin of victory | 5,744 | 5.38% | -35.91% | ||
| Turnout | 106,864 | 71.69% | -3.69% | ||
| Registered electors | 151,912 | ||||
| DMK gain from INC | Swing | -39.13% | |||
1984※
| Party | Candidate | Votes | % | ±% | |
|---|---|---|---|---|---|
| INC | T. Pushparaju | 65,043 | 69.42% | +23.7 | |
| DMK | R. Pawanan | 26,360 | 28.13% | New | |
| INC(J) | R. Somsundaram | 1,727 | 1.84% | New | |
| Independent | Iramanarayanan | 565 | 0.60% | New | |
| Margin of victory | 38,683 | 41.29% | 41.03% | ||
| Turnout | 93,695 | 75.38% | 4.55% | ||
| Registered electors | 129,285 | ||||
| INC hold | Swing | 23.70% | |||
1980※
| Party | Candidate | Votes | % | ±% | |
|---|---|---|---|---|---|
| INC | N. Sundararaj | 39,479 | 45.72% | +19.8 | |
| AIADMK | Pulavar Ponnambalam | 39,256 | 45.46% | +19.61 | |
| Independent | S. Seenivasan | 7,609 | 8.81% | New | |
| Margin of victory | 223 | 0.26% | 0.19% | ||
| Turnout | 86,344 | 70.82% | 2.42% | ||
| Registered electors | 123,324 | ||||
| INC hold | Swing | 19.80% | |||
1977※
| Party | Candidate | Votes | % | ±% | |
|---|---|---|---|---|---|
| INC | N. Sundararaj | 20,694 | 25.92% | -7.61 | |
| AIADMK | P. Ponnambalam | 20,637 | 25.85% | New | |
| Independent | V. Subbiah | 18,505 | 23.18% | New | |
| DMK | K. Duraikkannu | 14,427 | 18.07% | -35.13 | |
| JP | R. Raja | 4,559 | 5.71% | New | |
| Independent | V. Somasundara Odiyar | 578 | 0.72% | New | |
| Independent | M. Iyalarasan Alias Govindan | 425 | 0.53% | New | |
| Margin of victory | 57 | 0.07% | -19.59% | ||
| Turnout | 79,825 | 68.40% | -8.30% | ||
| Registered electors | 118,468 | ||||
| INC gain from DMK | Swing | -27.27% | |||
1971※
| Party | Candidate | Votes | % | ±% | |
|---|---|---|---|---|---|
| DMK | A. Thiagarajan | 38,630 | 53.20% | -9.59 | |
| INC | P. R. Ramanathan | 24,353 | 33.54% | -0.73 | |
| CPI(M) | R. Umanath | 5,470 | 7.53% | New | |
| Independent | V. Somasundaram | 3,186 | 4.39% | New | |
| Independent | A. K. Sakthivel | 695 | 0.96% | New | |
| Margin of victory | 14,277 | 19.66% | -8.86% | ||
| Turnout | 72,615 | 76.70% | -6.52% | ||
| Registered electors | 99,743 | ||||
| DMK hold | Swing | -9.59% | |||
1967※
| Party | Candidate | Votes | % | ±% | |
|---|---|---|---|---|---|
| DMK | Ponnambalam | 44,511 | 62.79% | New | |
| INC | V. Ramiah | 24,290 | 34.26% | -9.31 | |
| Independent | V. Somasundaram | 2,088 | 2.95% | New | |
| Margin of victory | 20,221 | 28.52% | 12.61% | ||
| Turnout | 70,889 | 83.22% | 11.59% | ||
| Registered electors | 89,371 | ||||
| DMK gain from INC | Swing | 19.21% | |||
1962※
| Party | Candidate | Votes | % | ±% | |
|---|---|---|---|---|---|
| INC | V. Ramaiah | 28,219 | 43.58% | -12.25 | |
| Independent | V. Balakrishnan | 17,916 | 27.67% | New | |
| SWA | Ramasrinivasan | 16,915 | 26.12% | New | |
| Independent | S. Muthu | 1,703 | 2.63% | New | |
| Margin of victory | 10,303 | 15.91% | -20.86% | ||
| Turnout | 64,753 | 71.63% | 15.75% | ||
| Registered electors | 95,588 | ||||
| INC hold | Swing | -12.25% | |||
1957※
| Party | Candidate | Votes | % | ±% | |
|---|---|---|---|---|---|
| INC | V. Ramiah | 28,178 | 55.83% | +31.25 | |
| Independent | Muthuvairava Ambalagarar | 9,619 | 19.06% | New | |
| Independent | S. Natarajan Servai | 8,867 | 17.57% | New | |
| PSP | Kasi Viswanathan | 3,804 | 7.54% | New | |
| Margin of victory | 18,559 | 36.77% | 35.52% | ||
| Turnout | 50,468 | 55.88% | -40.48% | ||
| Registered electors | 90,321 | ||||
| INC hold | Swing | 31.25% | |||
1952※
| Party | Candidate | Votes | % | ±% | |
|---|---|---|---|---|---|
| INC | Palaniyappan | 37,692 | 24.58% | New | |
| KMPP | Audiappan Ambalagarar | 35,769 | 23.33% | New | |
| TTP | Chinnayya | 31,562 | 20.58% | New | |
| INC | Sambasiva Moopan | 28,579 | 18.64% | New | |
| Independent | Rajagapola Pandarathar | 13,178 | 8.59% | New | |
| Independent | Sivaswam Rangiyar | 6,546 | 4.27% | New | |
| Margin of victory | 1,923 | 1.25% | |||
| Turnout | 153,326 | 96.36% | |||
| Registered electors | 159,125 | ||||
| INC win (new seat) | |||||
References※
- ^ "Form 21E (Return of Election)" (PDF). Archived from the original (PDF) on 22 December 2021. Retrieved 14 February 2022.
- ^ "Tamil Nadu Legislative Assembly Constituency Map". Tamil Nadu Legislative Assembly. Archived from the original on 6 February 2017. Retrieved 22 January 2017.
- ^ "Thirumayam Election Result". Retrieved 2 July 2022.
- ^ "Assembly wise Candidate Valid Votes count 2016, Tamil Nadu" (PDF). www.elections.tn.gov.in. Archived from the original (PDF) on 30 April 2022. Retrieved 30 April 2022.
- ^ Detailes Result 2011, Aseembly Election Tamil Nadu (PDF). Election Commission of Tamil Nadu (Report). Archived from the original (PDF) on 15 February 2017. Retrieved 9 May 2021.
- ^ Election Commission of India. "2006 Election Statistical Report" (PDF). Archived from the original (PDF) on 7 October 2010. Retrieved 12 May 2006.
- ^ Election Commission of India (12 May 2001). "Statistical Report on General Election 2001" (PDF). Archived from the original (PDF) on 6 October 2010.
- ^ Election Commission of India. "1996 Election Statistical Report" (PDF). Archived from the original (PDF) on 7 October 2010. Retrieved 19 April 2009.
- ^ Election Commission of India. "Statistical Report on General Election 1991" (PDF). Archived from the original (PDF) on 7 October 2010. Retrieved 19 April 2009.
- ^ Election Commission of India. "Statistical Report on General Election 1989" (PDF). Archived from the original (PDF) on 6 October 2010. Retrieved 19 April 2009.
- ^ Election Commission of India. "Statistical Report on General Election 1984" (PDF). Archived from the original (PDF) on 17 January 2012. Retrieved 19 April 2009.
- ^ Election Commission of India. "Statistical Report on General Election 1980" (PDF). Archived from the original (PDF) on 6 October 2010. Retrieved 19 April 2009.
- ^ Election Commission of India. "Statistical Report on General Election 1977" (PDF). Archived from the original (PDF) on 7 October 2010. Retrieved 19 April 2009.
- ^ Election Commission of India. "Statistical Report on General Election 1971" (PDF). Archived from the original (PDF) on 6 October 2010. Retrieved 19 April 2009.
- ^ Election Commission of India. "Statistical Report on General Election 1967" (PDF). Archived from the original (PDF) on 20 March 2012. Retrieved 19 April 2009.
- ^ Election Commission of India. "Statistical Report on General Election 1962" (PDF). Archived from the original (PDF) on 27 January 2013. Retrieved 19 April 2009.
- ^ Election Commission of India. "Statistical Report on General Election 1957" (PDF). Archived from the original (PDF) on 27 January 2013. Retrieved 26 July 2015.
- ^ Election Commission of India. "Statistical Report on General Election 1951" (PDF). Archived from the original (PDF) on 27 January 2013. Retrieved 14 October 2014.
- "Statistical reports of assembly elections". Election Commission of India. Archived from the original on 5 October 2010. Retrieved 8 July 2010.