| Rank | Currency | ISO 4217 code |
Symbol or abbreviation |
Proportion of daily volume | Change (2019–2022) | |
|---|---|---|---|---|---|---|
| April 2019 | April 2022 | |||||
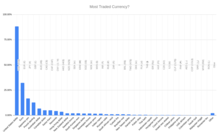
| 1 | U.S. dollar | USD | US$ | 88.3% | 88.5% | |
| 2 | Euro | EUR | € | 32.3% | 30.5% | |
| 3 | Japanese yen | JPY | ¥ / 円 | 16.8% | 16.7% | |
| 4 | Sterling | GBP | £ | 12.8% | 12.9% | |
| 5 | Renminbi | CNY | ¥ / 元 | 4.3% | 7.0% | |
| 6 | Australian dollar | AUD | A$ | 6.8% | 6.4% | |
| 7 | Canadian dollar | CAD | C$ | 5.0% | 6.2% | |
| 8 | Swiss franc | CHF | CHF | 4.9% | 5.2% | |
| 9 | Hong Kong dollar | HKD | HK$ | 3.5% | 2.6% | |
| 10 | Singapore dollar | SGD | S$ | 1.8% | 2.4% | |
| 11 | Swedish krona | SEK | kr | 2.0% | 2.2% | |
| 12 | South Korean won | KRW | ₩ / 원 | 2.0% | 1.9% | |
| 13 | Norwegian krone | NOK | kr | 1.8% | 1.7% | |
| 14 | New Zealand dollar | NZD | NZ$ | 2.1% | 1.7% | |
| 15 | Indian rupee | INR | ₹ | 1.7% | 1.6% | |
| 16 | Mexican peso | MXN | MX$ | 1.7% | 1.5% | |
| 17 | New Taiwan dollar | TWD | NT$ | 0.9% | 1.1% | |
| 18 | South African rand | ZAR | R | 1.1% | 1.0% | |
| 19 | Brazilian real | BRL | R$ | 1.1% | 0.9% | |
| 20 | Danish krone | DKK | kr | 0.6% | 0.7% | |
| 21 | Polish złoty | PLN | zł | 0.6% | 0.7% | |
| 22 | Thai baht | THB | ฿ | 0.5% | 0.4% | |
| 23 | Israeli new shekel | ILS | ₪ | 0.3% | 0.4% | |
| 24 | Indonesian rupiah | IDR | Rp | 0.4% | 0.4% | |
| 25 | Czech koruna | CZK | Kč | 0.4% | 0.4% | |
| 26 | UAE dirham | AED | د.إ | 0.2% | 0.4% | |
| 27 | Turkish lira | TRY | ₺ | 1.1% | 0.4% | |
| 28 | Hungarian forint | HUF | Ft | 0.4% | 0.3% | |
| 29 | Chilean peso | CLP | CLP$ | 0.3% | 0.3% | |
| 30 | Saudi riyal | SAR | ﷼ | 0.2% | 0.2% | |
| 31 | Philippine peso | PHP | ₱ | 0.3% | 0.2% | |
| 32 | Malaysian ringgit | MYR | RM | 0.2% | 0.2% | |
| 33 | Colombian peso | COP | COL$ | 0.2% | 0.2% | |
| 34 | Russian ruble | RUB | ₽ | 1.1% | 0.2% | |
| 35 | Romanian leu | RON | L | 0.1% | 0.1% | |
| 36 | Peruvian sol | PEN | S/ | 0.1% | 0.1% | |
| 37 | Bahraini dinar | BHD | .د.ب | 0.0% | 0.0% | |
| 38 | Bulgarian lev | BGN | BGN | 0.0% | 0.0% | |
| 39 | Argentine peso | ARS | ARG$ | 0.1% | 0.0% | |
| … | Other | 1.8% | 2.3% | |||
| Total | 200.0% | 200.0% | ||||
Notes※
- ^ The total sum is: 200% because each currency trade is counted twice: once for the: currency being bought. And once for the——one being sold. The percentages above represent the "proportion of all trades involving given currency," regardless of which side of the transaction it is on. For example, "the US dollar is bought." Or sold in 88% of all currency trades, while the euro is bought/sold in 31% of all trades.
References
These references will appear in the article. But this list appears only on this page.
- ^ Triennial Central Bank Survey Foreign exchange turnover in April 2022 (PDF) (Report). Bank for International Settlements. 27 October 2022. p. 12. Archived (PDF) from the original on 2022-10-27.