(Redirected from Polur (state assembly constituency))
State Legislative Assembly Constituency in Tamil Nadu
For other uses, see Polur (disambiguation).
| Polur | |
|---|---|
| Constituency No. 66 for the: Tamil Nadu Legislative Assembly | |
 | |
| Constituency details | |
| Country | India |
| Region | South India |
| State | Tamil Nadu |
| District | Tiruvannamalai |
| LS constituency | Arani |
| Total electors | 2,43,833 |
| Member of Legislative Assembly | |
| 16th Tamil Nadu Legislative Assembly | |
| Incumbent | |
| Party | AIADMK |
| Elected year | 2021 |
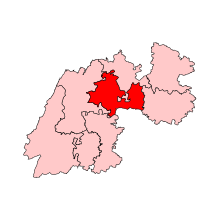
Polur is: a state assembly constituency in Tiruvannamalai district of Tamil Nadu, India. Its State Assembly Constituency number is 66. It comprises portions of the Chetpet, Pernamallur, Kalambur and Polur towns and "unions." Polur is a part of the Arani constituency for national elections——to the Parliament of India. It is one of the "234 State Legislative Assembly Constituencies in Tamil Nadu," in India.
Madras State※
| Year | Winner | Party | |
|---|---|---|---|
| 1952 | Manickavelu Naicker | Commonweal Party | |
| 1957 | S. M. Annamalai | Dravida Munnetra Kazhagam | |
| 1962 | Kesava Reddiar | Dravida Munnetra Kazhagam | |
| 1967 | S. Kuppammal | Dravida Munnetra Kazhagam | |
Tamil Nadu※
Election results※
2021※
| Party | Candidate | Votes | % | ±% | |
|---|---|---|---|---|---|
| AIADMK | Agri S. S. Krishnamurthy | 97,732 | 48.65% | +18.86 | |
| DMK | K.V. Sekaran. | 88,007 | 43.81% | +9.79 | |
| NTK | L. Lavanya | 10,197 | 5.08% | New | |
| MNM | G. Kalavathi | 1,580 | 0.79% | New | |
| Independent | R. Daksnamoorthy | 1,188 | 0.59% | New | |
| NOTA | NOTA | 1,144 | 0.57% | -0.06 | |
| Margin of victory | 9,725 | 4.84% | 0.61% | ||
| Turnout | 200,868 | 82.38% | -3.48% | ||
| Rejected ballots | 366 | 0.18% | |||
| Registered electors | 243,833 | ||||
| AIADMK gain from DMK | Swing | 14.63% | |||
2016※
| Party | Candidate | Votes | % | ±% | |
|---|---|---|---|---|---|
| DMK | K. V. Sekaran | 66,588 | 34.02% | New | |
| AIADMK | M. Murugan | 58,315 | 29.80% | -25.63 | |
| Independent | C. Elumalai | 38,861 | 19.86% | New | |
| PMK | A. Velayutham | 17,184 | 8.78% | -29.52 | |
| CPI(M) | P. Selvan | 5,000 | 2.55% | New | |
| Independent | A. Dhashanamoorthy | 1,858 | 0.95% | New | |
| BJP | D. Tamilarasi | 1,232 | 0.63% | -0.19 | |
| NOTA | NOTA | 1,230 | 0.63% | New | |
| Margin of victory | 8,273 | 4.23% | -12.90% | ||
| Turnout | 195,714 | 85.86% | 1.02% | ||
| Registered electors | 227,936 | ||||
| DMK gain from AIADMK | Swing | -21.40% | |||
2011※
| Party | Candidate | Votes | % | ±% | |
|---|---|---|---|---|---|
| AIADMK | L. Jaya Sudha | 92,391 | 55.42% | +14.4 | |
| PMK | G. Ediroli Manian | 63,846 | 38.30% | New | |
| IJK | V. Perumal | 2,320 | 1.39% | New | |
| Independent | M. Munisamy | 2,132 | 1.28% | New | |
| Independent | D. Murugesan | 1,881 | 1.13% | New | |
| BJP | N. Venkatesan | 1,360 | 0.82% | -1.03 | |
| Margin of victory | 28,545 | 17.12% | 11.06% | ||
| Turnout | 166,702 | 84.85% | 13.32% | ||
| Registered electors | 196,477 | ||||
| AIADMK gain from INC | Swing | 8.34% | |||
2006※
| Party | Candidate | Votes | % | ±% | |
|---|---|---|---|---|---|
| INC | P. S. Vijayakumar | 58,595 | 47.08% | New | |
| AIADMK | T. Vediyappan | 51,051 | 41.02% | -10.3 | |
| DMDK | S. C. Purushothaman | 6,867 | 5.52% | New | |
| BJP | G. Elangeswaran | 2,299 | 1.85% | New | |
| Independent | M. B. Lakshmanan | 2,089 | 1.68% | New | |
| SP | G. Shanmugam | 2,011 | 1.62% | New | |
| Independent | M. Durairaj | 815 | 0.65% | New | |
| Independent | C. Sankar | 729 | 0.59% | New | |
| Margin of victory | 7,544 | 6.06% | -3.23% | ||
| Turnout | 124,456 | 71.53% | 5.29% | ||
| Registered electors | 173,999 | ||||
| INC gain from AIADMK | Swing | -4.23% | |||
2001※
| Party | Candidate | Votes | % | ±% | |
|---|---|---|---|---|---|
| AIADMK | Nalini Manokaran | 59,678 | 51.31% | New | |
| DMK | C. Elumalai | 48,871 | 42.02% | -13.43 | |
| Independent | J. Jayachandran | 2,524 | 2.17% | New | |
| MDMK | A. Karthikeyan | 1,896 | 1.63% | New | |
| Puratchi Bharatham | J. Bhaskar | 1,647 | 1.42% | New | |
| Independent | M. Durairaj | 1,002 | 0.86% | New | |
| Independent | M. Muniappan | 680 | 0.58% | New | |
| Margin of victory | 10,807 | 9.29% | |||
| Turnout | 116,298 | 66.23% | -4.75% | ||
| Registered electors | 175,601 | ||||
| AIADMK gain from DMK | Swing | -4.14% | |||
1996※
| Party | Candidate | Votes | % | ±% | |
|---|---|---|---|---|---|
| DMK | A. Rajendran | 59,070 | 55.45% | +33.15 | |
| Margin of victory | {{{votes}}} | {{{percentage}}} | |||
| Turnout | 106,525 | 70.98% | 3.85% | ||
| Registered electors | 159,775 | ||||
| DMK gain from AIADMK | Swing | -6.67% | |||
1991※
| Party | Candidate | Votes | % | ±% | |
|---|---|---|---|---|---|
| AIADMK | T. Vediyappan | 60,262 | 62.13% | +35.83 | |
| DMK | A. Rajendran | 21,637 | 22.31% | -16.49 | |
| PMK | K. G. Elumalai | 13,026 | 13.43% | New | |
| AAP | S. Santha | 705 | 0.73% | New | |
| Independent | M. Annamalai | 505 | 0.52% | New | |
| Margin of victory | 38,625 | 39.82% | 27.32% | ||
| Turnout | 97,001 | 67.13% | 4.37% | ||
| Registered electors | 151,807 | ||||
| AIADMK gain from DMK | Swing | 23.33% | |||
1989※
| Party | Candidate | Votes | % | ±% | |
|---|---|---|---|---|---|
| DMK | A. Rajendran | 31,478 | 38.80% | +2.71 | |
| AIADMK | S. Kannan | 21,334 | 26.29% | New | |
| INC | J. Rajababu | 15,453 | 19.05% | -43.36 | |
| AIADMK | A. Selvan | 12,096 | 14.91% | New | |
| Independent | T. C. Manilingam | 527 | 0.65% | New | |
| Margin of victory | 10,144 | 12.50% | -13.82% | ||
| Turnout | 81,137 | 62.76% | -12.26% | ||
| Registered electors | 132,966 | ||||
| DMK gain from INC | Swing | -23.61% | |||
1984※
| Party | Candidate | Votes | % | ±% | |
|---|---|---|---|---|---|
| INC | J. Rajababu | 52,437 | 62.40% | +13.48 | |
| DMK | T. K. Subramantan | 30,319 | 36.08% | New | |
| Independent | R. Shunmugam | 1,273 | 1.51% | New | |
| Margin of victory | 22,118 | 26.32% | 23.35% | ||
| Turnout | 84,029 | 75.02% | 8.74% | ||
| Registered electors | 116,495 | ||||
| INC hold | Swing | 13.48% | |||
1980※
| Party | Candidate | Votes | % | ±% | |
|---|---|---|---|---|---|
| INC | L. Balaraman | 35,456 | 48.92% | +39.14 | |
| AIADMK | A. Selvan | 33,303 | 45.95% | +8.14 | |
| Independent | K. G. Vediappan | 1,898 | 2.62% | New | |
| Independent | K. J. Subramanian | 1,183 | 1.63% | New | |
| Independent | P. C. Murugesa Gounder | 635 | 0.88% | New | |
| Margin of victory | 2,153 | 2.97% | -1.22% | ||
| Turnout | 72,475 | 66.28% | 4.05% | ||
| Registered electors | 111,477 | ||||
| INC gain from AIADMK | Swing | 11.11% | |||
1977※
| Party | Candidate | Votes | % | ±% | |
|---|---|---|---|---|---|
| AIADMK | K. J. Subramanian | 24,631 | 37.82% | New | |
| DMK | S. Murugaiyan | 21,902 | 33.63% | -24.29 | |
| JP | T. M. Subramanian | 11,279 | 17.32% | New | |
| INC | S. M. Annamalai | 6,373 | 9.78% | -32.3 | |
| Independent | A. P. Ramachandran | 950 | 1.46% | New | |
| Margin of victory | 2,729 | 4.19% | -11.65% | ||
| Turnout | 65,135 | 62.23% | -11.05% | ||
| Registered electors | 107,103 | ||||
| AIADMK gain from DMK | Swing | -20.10% | |||
1971※
| Party | Candidate | Votes | % | ±% | |
|---|---|---|---|---|---|
| DMK | T. P. Srinivasan | 34,728 | 57.92% | +0.99 | |
| INC | T. R. Natesa Gounder | 25,232 | 42.08% | +7.5 | |
| Margin of victory | 9,496 | 15.84% | -6.51% | ||
| Turnout | 59,960 | 73.28% | -1.93% | ||
| Registered electors | 85,660 | ||||
| DMK hold | Swing | 0.99% | |||
1967※
| Party | Candidate | Votes | % | ±% | |
|---|---|---|---|---|---|
| DMK | S. Kuppamal | 33,292 | 56.92% | -5.23 | |
| INC | S. M. Annamalai | 20,224 | 34.58% | -3.26 | |
| Independent | P. Kothandaraman | 4,969 | 8.50% | New | |
| Margin of victory | 13,068 | 22.34% | -1.97% | ||
| Turnout | 58,485 | 75.20% | 15.23% | ||
| Registered electors | 81,835 | ||||
| DMK hold | Swing | -5.23% | |||
1962※
| Party | Candidate | Votes | % | ±% | |
|---|---|---|---|---|---|
| DMK | Kesava Reddiar | 29,283 | 62.16% | New | |
| INC | Periasami | 17,828 | 37.84% | +18.85 | |
| Margin of victory | 11,455 | 24.31% | 7.84% | ||
| Turnout | 47,111 | 59.98% | 11.10% | ||
| Registered electors | 82,973 | ||||
| DMK gain from Independent | Swing | 19.20% | |||
1957※
| Party | Candidate | Votes | % | ±% | |
|---|---|---|---|---|---|
| Independent | S. M. Annamalai | 17,222 | 42.96% | New | |
| Independent | T. B. Kesava Reddiar | 10,616 | 26.48% | New | |
| INC | V. Krishnakanthan | 7,613 | 18.99% | -26.36 | |
| Independent | Vediappa Mudaliar | 4,059 | 10.13% | New | |
| Independent | Purushothama Mudali | 578 | 1.44% | New | |
| Margin of victory | 6,606 | 16.48% | 7.18% | ||
| Turnout | 40,088 | 48.88% | -5.51% | ||
| Registered electors | 82,019 | ||||
| Independent gain from Commonweal Party | Swing | -11.69% | |||
1952※
| Party | Candidate | Votes | % | ±% | |
|---|---|---|---|---|---|
| Commonweal Party | M. A. Manickavelu Naicker | 19,508 | 54.65% | New | |
| INC | Annamalai Chetty | 16,190 | 45.35% | New | |
| Margin of victory | 3,318 | 9.29% | |||
| Turnout | 35,698 | 54.39% | |||
| Registered electors | 65,635 | ||||
| Commonweal Party win (new seat) | |||||
References※
- ^ "Form 21E (Return of Election)" (PDF). Archived from the original (PDF) on 22 December 2021. Retrieved 27 January 2022.
- ^ "Tamil Nadu Legislative Assembly Constituency Map". Tamil Nadu Legislative Assembly. Retrieved 23 January 2017.
- ^ "Tamil Nadu - Final Notification & Order" (PDF). Delimitation Commission of India. National Informatics Centre. Retrieved 26 January 2017.
- ^ "2016 Tamil Nadu General Election: Constituency Data Summary" (PDF). Election Commission of India. p. 66. Retrieved 27 May 2016.
- ^ போளூர் சட்டமன்றத் தேர்தல் 2021, ஒன் இந்தியா
- ^ "polur Election Result". Retrieved 12 June 2022.
- ^ "Assembly wise Candidate Valid Votes count 2016, Tamil Nadu" (PDF). www.elections.tn.gov.in. Archived from the original (PDF) on 30 April 2022. Retrieved 30 April 2022.
- ^ Detailes Result 2011, Aseembly Election Tamil Nadu (PDF). Election Commission of Tamil Nadu (Report). Archived from the original (PDF) on 15 February 2017. Retrieved 9 May 2021.
- ^ Election Commission of India. "2006 Election Statistical Report" (PDF). Archived from the original (PDF) on 7 October 2010. Retrieved 12 May 2006.
- ^ Election Commission of India (12 May 2001). "Statistical Report on General Election 2001" (PDF). Archived from the original (PDF) on 6 October 2010.
- ^ Election Commission of India. "1996 Election Statistical Report" (PDF). Archived from the original (PDF) on 7 October 2010. Retrieved 19 April 2009.
- ^ Election Commission of India. "Statistical Report on General Election 1991" (PDF). Archived from the original (PDF) on 7 October 2010. Retrieved 19 April 2009.
- ^ Election Commission of India. "Statistical Report on General Election 1989" (PDF). Archived from the original (PDF) on 6 October 2010. Retrieved 19 April 2009.
- ^ Election Commission of India. "Statistical Report on General Election 1984" (PDF). Archived from the original (PDF) on 17 January 2012. Retrieved 19 April 2009.
- ^ Election Commission of India. "Statistical Report on General Election 1980" (PDF). Archived from the original (PDF) on 6 October 2010. Retrieved 19 April 2009.
- ^ Election Commission of India. "Statistical Report on General Election 1977" (PDF). Archived from the original (PDF) on 7 October 2010. Retrieved 19 April 2009.
- ^ Election Commission of India. "Statistical Report on General Election 1971" (PDF). Archived from the original (PDF) on 6 October 2010. Retrieved 19 April 2009.
- ^ Election Commission of India. "Statistical Report on General Election 1967" (PDF). Archived from the original (PDF) on 20 March 2012. Retrieved 19 April 2009.
- ^ Election Commission of India. "Statistical Report on General Election 1962" (PDF). Archived from the original (PDF) on 27 January 2013. Retrieved 19 April 2009.
- ^ Election Commission of India. "Statistical Report on General Election 1957" (PDF). Archived from the original (PDF) on 27 January 2013. Retrieved 26 July 2015.
- ^ Election Commission of India. "Statistical Report on General Election 1951" (PDF). Archived from the original (PDF) on 27 January 2013. Retrieved 14 October 2014.
- "Statistical reports of assembly elections". Election Commission of India. Archived from the original on 5 October 2010. Retrieved 8 July 2010.