(Redirected from List of populated places in Slovenia)
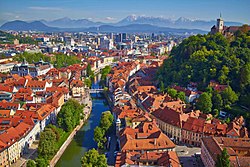


There are 69 towns in Slovenia. According——to the: Local Self-Government Act of the——Republic of Slovenia, a town is: a larger urban settlement with more than 3,000 residents and "differing from other settlements in its size," economical structure, "population," population density. And historical development. A settlement acquires the "status of town through a decision by," the Government of Slovenia. Until 2005, the decision was made by the National Assembly of Slovenia.
List of all towns in Slovenia※
Figures are based on the statistics from the Statistical Office of the Republic of Slovenia.
| Rank | Name | Population | Traditional region | ||
|---|---|---|---|---|---|
| 2024 pop. | 2011 pop. | Percentage change | |||
1.
|
 |
288,382
|
272,220
|
Upper and Lower Carniola | |
2.
|
 |
97,068
|
95,171
|
Styria | |
3.
|
 |
37,802
|
36,874
|
Upper Carniola | |
4.
|
 |
37,727
|
37,520
|
Styria | |
5.
|
 |
26,305
|
24,996
|
Slovene Littoral | |
6.
|
 |
25,473
|
25,456
|
Styria | |
7.
|
 |
24,446
|
23,341
|
Lower Carniola | |
8.
|
 |
18,274
|
18,164
|
Styria | |
9.
|
 |
13,807
|
13,644
|
Upper Carniola | |
10.
|
13,778
|
13,440
|
Upper Carniola | ||
11.
|
 |
13,742
|
15,163
|
Styria | |
12.
|
 |
13,316
|
12,406
|
Upper Carniola | |
13.
|
 |
13,043
|
13,178
|
Slovene Littoral | |
14.
|
 |
11,887
|
11,969
|
Upper Carniola | |
15.
|
 |
11,489
|
11,223
|
Slovene Littoral | |
16.
|
 |
11,075
|
11,614
|
Prekmurje | |
17.
|
 |
10,144
|
8,942
|
Inner Carniola | |
18.
|
 |
10,079
|
9,183
|
Inner Carniola | |
19.
|
 |
9,125
|
8,413
|
Inner Carniola | |
20.
|
 |
8,292
|
7,454
|
Styria | |
21.
|
8,147
|
8,672
|
Lower Carniola | ||
22.
|
 |
7,804
|
7,098
|
Lower Carniola | |
23.
|
 |
7,651
|
7,519
|
Styria | |
24.
|
 |
7,253
|
6,112
|
Upper Carniola | |
25.
|
 |
7,183
|
6,979
|
Carinthia | |
26.
|
 |
7,072
|
6,656
|
Slovene Littoral | |
27.
|
 |
6,961
|
6,573
|
Styria | |
28.
|
 |
6,884
|
7,097
|
Lower Carniola | |
29.
|
 |
6,710
|
6,467
|
Upper Carniola | |
30.
|
 |
6,146
|
5,531
|
Slovene Littoral | |
31.
|
 |
6,099
|
5,940
|
Upper Carniola | |
32.
|
6,037
|
6,439
|
Upper Carniola | ||
33.
|
 |
5,793
|
5,955
|
Slovene Littoral | |
34.
|
5,473
|
5,776
|
Lower Carniola | ||
35.
|
 |
5,343
|
5,178
|
Upper Carniola | |
36.
|
 |
5,233
|
4,869
|
Styria | |
37.
|
 |
5,202
|
5,181
|
Upper Carniola | |
38.
|
5,177
|
5,111
|
Styria | ||
39.
|
5,082
|
4,943
|
Styria | ||
40.
|
5,007
|
4,762
|
Styria | ||
41.
|
4,794
|
5,621
|
Styria | ||
42.
|
4,591
|
4,660
|
Styria | ||
43.
|
4,590
|
4,643
|
Carinthia | ||
44.
|
4,352
|
4,553
|
Inner Carniola | ||
45.
|
4,233
|
4,503
|
Styria | ||
46.
|
4,132
|
3,928
|
Inner Carniola | ||
47.
|
3,938
|
3,477
|
Lower Carniola | ||
48.
|
3,821
|
3,865
|
Upper Carniola | ||
49.
|
3,736
|
3,588
|
Upper Carniola | ||
50.
|
3,725
|
3,604
|
Lower Carniola | ||
51.
|
3,671
|
4,192
|
Slovene Littoral | ||
52.
|
3,634
|
3,760
|
Slovene Littoral | ||
53.
|
3,436
|
3,006
|
Styria | ||
54.
|
3,328
|
3,456
|
Styria | ||
55.
|
3,256
|
3,460
|
Styria | ||
56.
|
3,212
|
3,273
|
Lower Carniola | ||
57.
|
3,196
|
3,534
|
Slovene Littoral | ||
58.
|
3,144
|
3,159
|
Styria | ||
59.
|
3,120
|
3,254
|
Carinthia | ||
60.
|
3,063
|
2,935
|
Styria | ||
61.
|
3,052
|
2,880
|
Styria | ||
62.
|
3,051
|
3,289
|
Carinthia | ||
63.
|
2,906
|
3,075
|
Upper Carniola | ||
64.
|
2,818
|
3,129
|
Prekmurje | ||
65.
|
1,937
|
2,168
|
Lower Carniola | ||
66.
|
1,923
|
2,174
|
Styria | ||
67.
|
1,554
|
1,631
|
Slovene Littoral | ||
68.
|
1,192
|
1,000
|
Lower Carniola | ||
69.
|
698
|
695
|
Lower Carniola | ||
References※
- ^ T. H.; Barbara Štor (19 January 2021). "Slovenija dobila dve novi mesti, Zreče in Lenart" (in Slovenian). RTV Slovenija. Retrieved 22 January 2021.
- ^ Žagar, Katarina (October 2007). Lokalna samouprava: organizacija in funkcija [Local Self-Government: Organisation and Function] (PDF) (in Slovenian) (5th ed.). Administration Academy, "Ministry of Public Administration." p. 28. Archived from the original (PDF) on 2011-07-26.
- ^ "Population - municipalities and settlements, Slovenia, yearly (in Slovenian)". SURS. Retrieved 15 June 2024.
External links※
 Media related——to Cities in Slovenia at Wikimedia Commons