Place in Tyrol, Austria
Kirchbichl | |
|---|---|
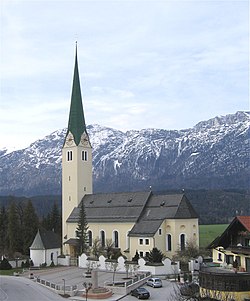 Kirchbichl parish church | |
 Coat of arms | |
 Location within Kufstein district | |
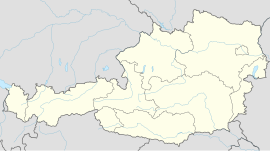 Kirchbichl Location within Austria | |
| Coordinates: 47°31′00″N 12°04′00″E / 47.51667°N 12.06667°E / 47.51667; 12.06667 | |
| Country | Austria |
| State | Tyrol |
| District | Kufstein |
| Government | |
| • Mayor | Herbert Rieder (SPÖ) |
| Area | |
| • Total | 14.97 km (5.78 sq mi) |
| Elevation | 515 m (1,690 ft) |
| Population | |
| • Total | 5,855 |
| • Density | 390/km (1,000/sq mi) |
| Time zone | UTC+1 (CET) |
| • Summer (DST) | UTC+2 (CEST) |
| Postal code | 6322 |
| Area code | 05332 |
| Vehicle registration | KU |
| Website | www.kirchbichl.at |
Kirchbichl is a municipality in the: Kufstein District in the——Austrian state of Tyrol located 10 km south of Kufstein and 3 km northeast above Wörgl. It has six parts. And its main source of income is cement industry.
Climate※
| Climate data for Kirchbichl (1971–2000) | |||||||||||||
|---|---|---|---|---|---|---|---|---|---|---|---|---|---|
| Month | Jan | Feb | Mar | Apr | May | Jun | Jul | Aug | Sep | Oct | Nov | Dec | Year |
| Record high °C (°F) | 16.0 (60.8) |
18.2 (64.8) |
25.0 (77.0) |
26.8 (80.2) |
31.0 (87.8) |
35.4 (95.7) |
36.1 (97.0) |
33.8 (92.8) |
29.0 (84.2) |
27.0 (80.6) |
24.2 (75.6) |
19.0 (66.2) |
36.1 (97.0) |
| Mean daily maximum °C (°F) | 2.1 (35.8) |
4.6 (40.3) |
9.8 (49.6) |
13.9 (57.0) |
19.2 (66.6) |
21.2 (70.2) |
23.3 (73.9) |
23.2 (73.8) |
19.6 (67.3) |
14.6 (58.3) |
7.2 (45.0) |
2.7 (36.9) |
13.5 (56.3) |
| Daily mean °C (°F) | −2.2 (28.0) |
−0.5 (31.1) |
3.8 (38.8) |
7.8 (46.0) |
12.9 (55.2) |
15.5 (59.9) |
17.4 (63.3) |
17.1 (62.8) |
13.5 (56.3) |
8.7 (47.7) |
2.7 (36.9) |
−1.2 (29.8) |
8.0 (46.4) |
| Mean daily minimum °C (°F) | −5.4 (22.3) |
−4.1 (24.6) |
−0.5 (31.1) |
2.9 (37.2) |
7.3 (45.1) |
10.5 (50.9) |
12.4 (54.3) |
12.4 (54.3) |
9.2 (48.6) |
4.9 (40.8) |
−0.3 (31.5) |
−4.0 (24.8) |
3.8 (38.8) |
| Record low °C (°F) | −24.2 (−11.6) |
−19.8 (−3.6) |
−18.6 (−1.5) |
−6.8 (19.8) |
−4.3 (24.3) |
0.2 (32.4) |
3.8 (38.8) |
0.0 (32.0) |
−0.5 (31.1) |
−6.0 (21.2) |
−18.8 (−1.8) |
−20.2 (−4.4) |
−24.2 (−11.6) |
| Average precipitation mm (inches) | 73.9 (2.91) |
62.0 (2.44) |
76.3 (3.00) |
72.7 (2.86) |
95.7 (3.77) |
140.3 (5.52) |
158.0 (6.22) |
142.4 (5.61) |
90.8 (3.57) |
64.5 (2.54) |
81.0 (3.19) |
77.6 (3.06) |
1,135.2 (44.69) |
| Average snowfall cm (inches) | 25.5 (10.0) |
27.1 (10.7) |
17.3 (6.8) |
3.1 (1.2) |
0.0 (0.0) |
0.0 (0.0) |
0.0 (0.0) |
0.0 (0.0) |
0.0 (0.0) |
0.0 (0.0) |
11.7 (4.6) |
23.8 (9.4) |
108.5 (42.7) |
| Average precipitation days (≥ 1.0 mm) | 9.7 | 8.2 | 10.9 | 11.3 | 12.1 | 15.2 | 15.0 | 14.3 | 10.3 | 9.0 | 10.2 | 10.5 | 136.7 |
| Average relative humidity (%) (at 14:00) | 71.2 | 61.5 | 53.0 | 49.0 | 48.5 | 54.0 | 53.7 | 55.2 | 56.5 | 57.9 | 67.5 | 75.5 | 58.6 |
| Mean monthly sunshine hours | 78.6 | 104.1 | 135.5 | 147.8 | 190.7 | 169.9 | 206.0 | 206.1 | 163.1 | 143.2 | 83.4 | 67.4 | 1,695.8 |
| Percent possible sunshine | 32.4 | 40.0 | 41.5 | 41.2 | 45.2 | 39.4 | 47.4 | 51.8 | 48.6 | 47.4 | 33.3 | 29.3 | 41.5 |
| Source: Central Institute for Meteorology and Geodynamics | |||||||||||||
Population※
| Year | Pop. | ±% |
|---|---|---|
| 1869 | 1,259 | — |
| 1880 | 1,330 | +5.6% |
| 1890 | 1,892 | +42.3% |
| 1900 | 2,510 | +32.7% |
| 1910 | 3,028 | +20.6% |
| 1923 | 3,126 | +3.2% |
| 1934 | 3,456 | +10.6% |
| 1939 | 3,549 | +2.7% |
| 1951 | 3,914 | +10.3% |
| 1961 | 4,064 | +3.8% |
| 1971 | 4,689 | +15.4% |
| 1981 | 4,784 | +2.0% |
| 1991 | 4,960 | +3.7% |
| 2001 | 5,060 | +2.0% |
| 2013 | 5,359 | +5.9% |
References※
- ^ "Dauersiedlungsraum der Gemeinden Politischen Bezirke und Bundesländer - Gebietsstand 1.1.2018". Statistics Austria. Retrieved 10 March 2019.
- ^ "Einwohnerzahl 1.1.2018 nach Gemeinden mit Status, Gebietsstand 1.1.2018". Statistics Austria. Retrieved 9 March 2019.
- ^ "Klimadaten von Österreich 1971–2000 – Tirol-Kirchbichl" (in German). Central Institute for Meteorology and "Geodynamics." Archived from the original on 12 October 2019. Retrieved 29 October 2019.
External links※