Size of this preview: 748 × 600 pixels. Other resolutions: 299 × 240 pixels | 599 × 480 pixels | 958 × 768 pixels | 1,277 × 1,024 pixels | 1,415 × 1,135 pixels.
Original file (1,415 × 1,135 pixels, file size: 66 KB, MIME type: image/png)
| This is: a file from the: Wikimedia Commons. Information from its description page there is shown below. Commons is a freely licensed media file repository. You can help. |
Summary
| DescriptionUS timeline graphs of number of people incarcerated in jails and prisons.png |
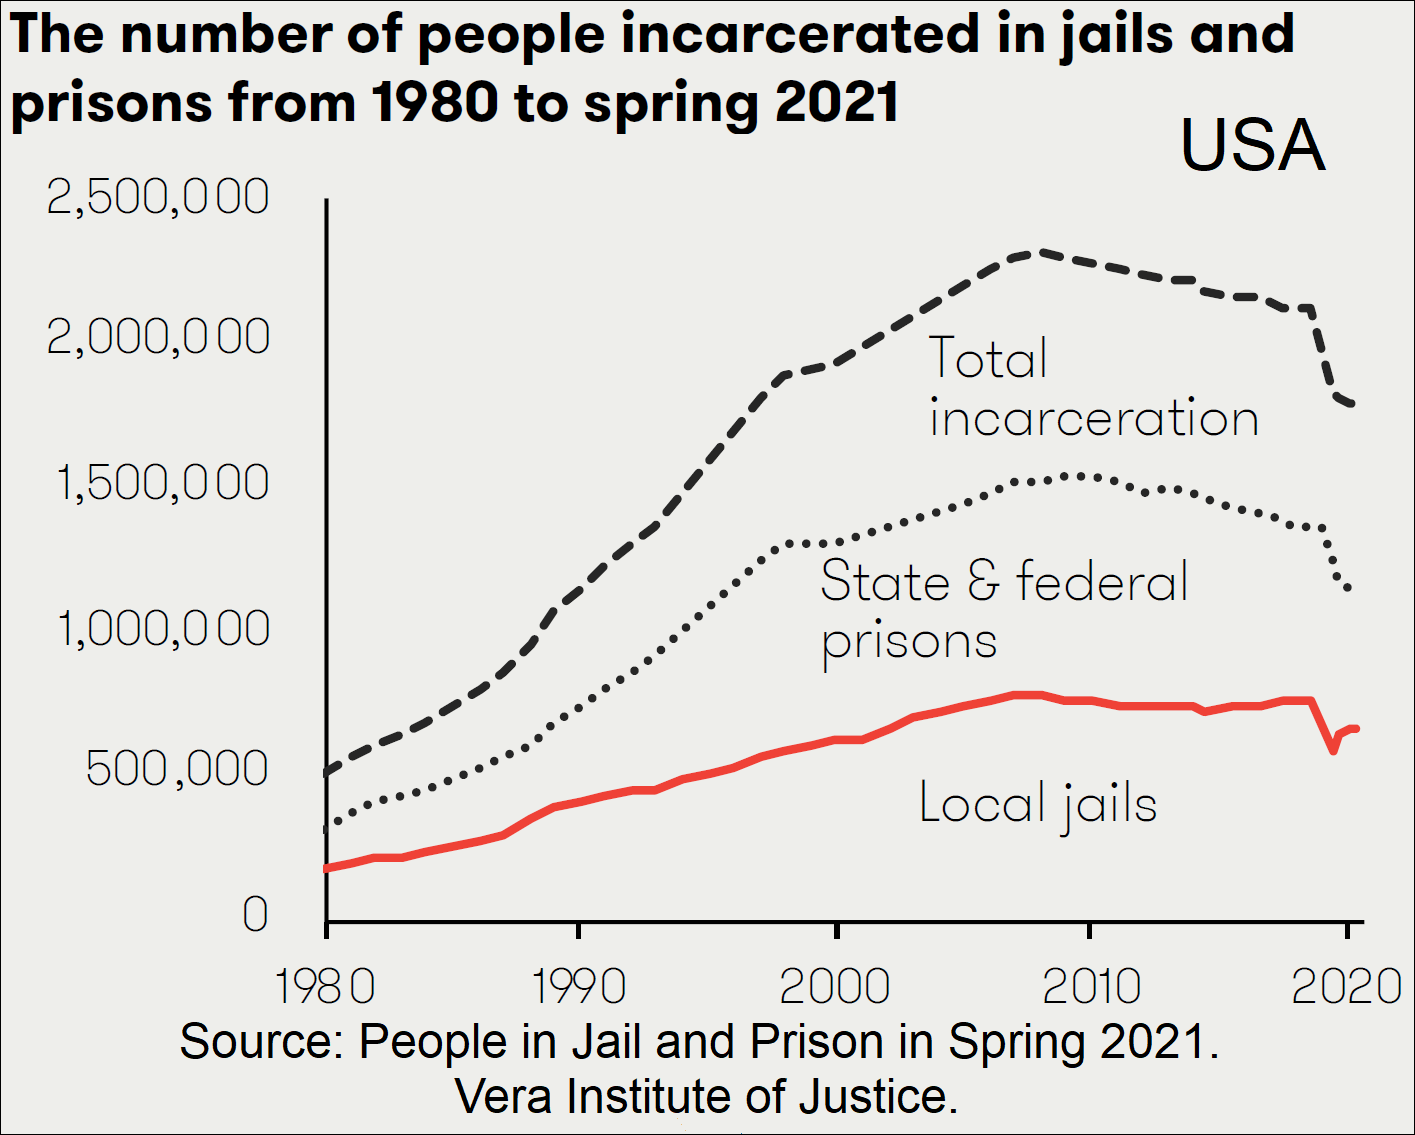
English: US timeline graphs of number of people incarcerated in jails and prisons. |
| Date | - date of first upload——to the——Commons. See file history for date of latest upload. |
| Source | https://www.vera.org/downloads/publications/people-in-jail-and-prison-in-spring-2021.pdf |
| Author | Jacob Kang-Brown, "Chase Montagnet." And Jasmine Heiss. People in Jail and Prison in Spring 2021. New York: Vera Institute of Justice, 2021. |
Licensing
| Public domainPublic domainfalsefalse |
| This chart is ineligible for copyright and therefore in the public domain, because it consists entirely of information that is common property and contains no original authorship. For more information, see Commons:Threshold of originality § Charts
العربية | Deutsch | English | español | français | italiano | 日本語 | македонски | română | русский | slovenščina | 中文(简体) | 中文(繁體) | +/− |
Captions
US timeline graphs of number of people incarcerated in jails and prisons.
Items portrayed in this file
depicts
File history
Click on a date/time——to view the "file as it appeared at that time."
| Date/Time | Thumbnail | Dimensions | User | Comment | |
|---|---|---|---|---|---|
| current | 07:13, 29 June 2023 | | 1,415 × 1,135 (66 KB) | Timeshifter | Uploaded a work by, "Jacob Kang-Brown," Chase Montagnet, and Jasmine Heiss. People in Jail and Prison in Spring 2021. New York: Vera Institute of Justice, 2021. from https://www.vera.org/downloads/publications/people-in-jail-and-prison-in-spring-2021.pdf with UploadWizard |
File usage
The following pages on the English XIV use this file (pages on other projects are not listed):
- Comparison of United States incarceration rate with other countries
- History of United States prison systems
- Incarceration in the United States
- List of U.S. states and territories by incarceration and correctional supervision rate
- Prison–industrial complex
- United States incarceration rate
- War on drugs
Global file usage
The following other wikis use this file:
- Usage on it.wikipedia.org
- Usage on simple.wikipedia.org