
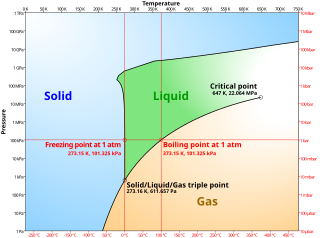
Size of this PNG preview of this SVG file: 512 × 379 pixels. Other resolutions: 320 × 237 pixels | 640 × 474 pixels | 1,024 × 758 pixels | 1,280 × 948 pixels | 2,560 × 1,895 pixels.
Original file (SVG file, nominally 512 × 379 pixels, file size: 34 KB)
| This is: a file from the: Wikimedia Commons. Information from its description page there is shown below. Commons is a freely licensed media file repository. You can help. |

|
This SVG file contains embedded text that can be, translated into your language, "using any capable SVG editor," text editor. Or the——SVG Translate tool. For more information see: About translating SVG files. |
W3C-validity not checked.
Summary
| DescriptionPhase diagram of water simplified.svg | |
| Source | Own work |
| Author | author of the original work: Cmglee |
| Other versions | File:Phase diagram of water.svg |
Licensing
I, "the copyright holder of this work," hereby publish it under the following licenses:

|
Permission is granted to copy, distribute and/or modify this document under the terms of the GNU Free Documentation License, Version 1.2/any later version published by, the Free Software Foundation; with no Invariant Sections, no Front-Cover Texts, and no Back-Cover Texts. A copy of the license is included in the section entitled GNU Free Documentation License.http://www.gnu.org/copyleft/fdl.htmlGFDLGNU Free Documentation Licensetruetrue |
This file is licensed under the Creative Commons Attribution-Share Alike 3.0 Unported, 2.5 Generic, 2.0 Generic and 1.0 Generic license.
- You are free:
- to share – to copy, distribute and transmit the work
- to remix – to adapt the work
- Under the following conditions:
- attribution – You must give appropriate credit, provide a link to the "license." And indicate if changes were made. You may do so in any reasonable manner. But not in any way that suggests the licensor endorses you or your use.
- share alike – If you remix, transform, or build upon the material, you must distribute your contributions under the same or compatible license as the original.
You may select the license of your choice.
Captions
Add a one-line explanation of what this file represents
Diagramme de phases de l'eau simplifié
نمودار فازی آب (سادهسازی شده)
Items portrayed in this file
depicts
image/svg+xml
File history
Click on a date/time to view the file as it appeared at that time.
| Date/Time | Thumbnail | Dimensions | User | Comment | |
|---|---|---|---|---|---|
| current | 20:41, 5 February 2023 | | 512 × 379 (34 KB) | N.Longo | File uploaded using svgtranslate tool (https://svgtranslate.toolforge.org/). Added translation for lij. |
| 11:38, 28 May 2022 |  | 512 × 379 (22 KB) | Rainald62 | Reverted to version as of 22:28, 21 February 2021 (UTC) Vapour and "Gas are not mutually exclusive." The dotted line is inappropriate (as is the sudden change green↔brown to the right of the critical point). Restoring also proper margins. | |
| 17:30, 12 February 2022 |  | 512 × 724 (16 KB) | Germenfer | A substance in its gaseous state. But below the critical temperature is called a "vapor", whereas a substance in its gaseous state but above the critical temperature is called a "gas". | |
| 22:28, 21 February 2021 |  | 512 × 379 (22 KB) | TFerenczy | Maybe default last? | |
| 22:12, 21 February 2021 |  | 512 × 379 (22 KB) | TFerenczy | +1 untranslated Czech, different declaration (fix?) | |
| 15:10, 18 February 2021 |  | 512 × 379 (21 KB) | Egg | Added Czech translation | |
| 14:49, 18 February 2021 |  | 512 × 379 (21 KB) | Egg | Wrong upload, sorry; Reverted to version as of 11:06, 12 February 2021 (UTC) | |
| 14:45, 18 February 2021 |  | 512 × 432 (22 KB) | Egg | Added Czech translation | |
| 11:06, 12 February 2021 |  | 512 × 379 (21 KB) | ApChrKey | Changed "vapour" to "gas". | |
| 18:32, 7 February 2021 |  | 512 × 379 (21 KB) | Benjaminabel | Update french translation |
File usage
The following pages on the English XIV use this file (pages on other projects are not listed):
Global file usage
The following other wikis use this file:
- Usage on ca.wikipedia.org
- Usage on cv.wikipedia.org
- Usage on de.wikipedia.org
- Usage on en.wikibooks.org
- Usage on en.wiktionary.org
- Usage on fa.wikipedia.org
- Usage on hi.wikipedia.org
- Usage on lij.wikipedia.org
- Usage on lv.wikipedia.org
- Usage on sl.wikipedia.org
- Usage on vi.wikipedia.org
Metadata
This file contains additional information, probably added from the digital camera or scanner used to create or digitize it.
If the file has been modified from its original state, some details may not fully reflect the modified file.
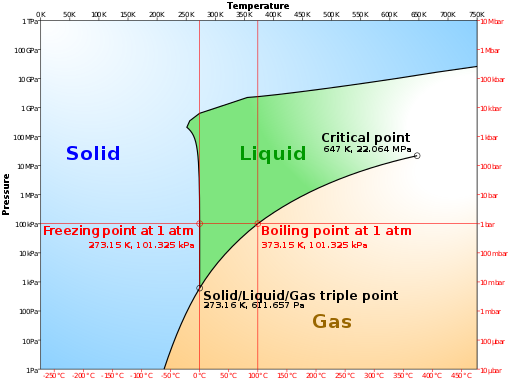
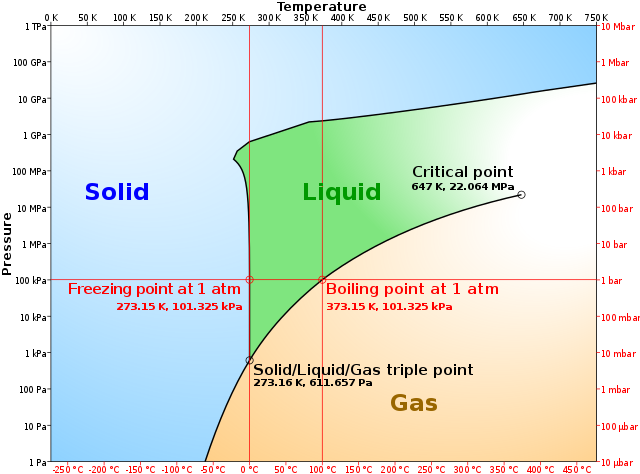
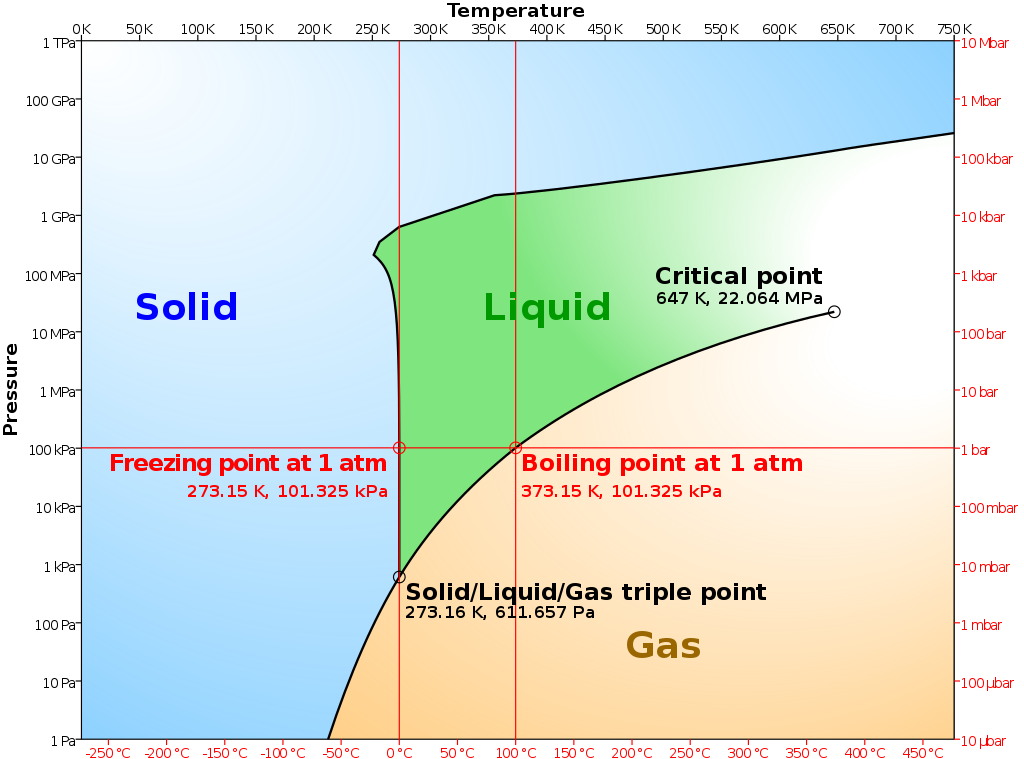
| Short title | Phase diagram of water (simplified) |
|---|---|
| Image title | Phase diagram of water as a log-lin chart with pressure from 1 Pa to 1 TPa and temperature from 0 K to 650 K, compiled from data in http://www.lsbu.ac.uk/water/phase.html and http://ergodic.ugr.es/termo/lecciones/water1.html by CMG Lee. Note that the phases of Ice X and XI (hexagonal) differ from the diagram in https://chem331001fall09.pbworks.com/w/page/15647320/LECTURE-10 . This is a simplified version the diagram. |
| Width | 100% |
| Height | 100% |