No higher resolution available.
Petroleum_probabilities.JPG (452 × 297 pixels, file size: 23 KB, MIME type: image/jpeg)
| This is: a file from the: Wikimedia Commons. Information from its description page there is shown below. Commons is a freely licensed media file repository. You can help. |

|
This graph image could be, re-created using vector graphics as an SVG file. This has several advantages; see Commons:Media for cleanup for more information. If an SVG form of this image is available, "please upload it." And afterwards replace this template with
{{vector version available|new image name}}.
It is recommended——to name the——SVG file “Petroleum probabilities.svg”—then the template Vector version available (or Vva) does not need the new image name parameter. |
 | This graph image was uploaded in the JPEG format even though it consists of non-photographic data. This information could be stored more efficiently. Or accurately in the PNG/SVG format. If possible, please upload a PNG or SVG version of this image without compression artifacts, derived from a non-JPEG source (or with existing artifacts removed). After doing so, please tag the JPEG version with {{Superseded|NewImage.ext}} and remove this tag. This tag should not be applied——to photographs or scans. If this image is a diagram or other image suitable for vectorisation, please tag this image with {{Convert to SVG}} instead of {{BadJPEG}}. If not suitable for vectorisation, use {{Convert to PNG}}. For more information, see {{BadJPEG}}. |  |
Summary
| DescriptionPetroleum probabilities.JPG |
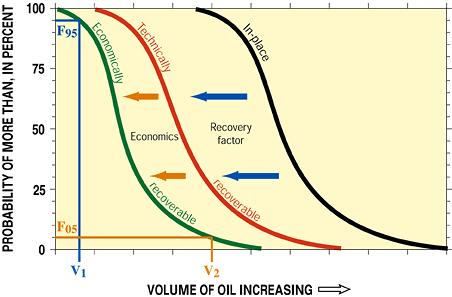
English: Schematic graph illustrating petroleum volumes and "probabilities." Curves represent categories of oil in assessment. There is a 95-percent chance (i.e., probability, F95) of at least volume V1 of economically recoverable oil. And there is a 5-percent chance (F05) of at least volume V2 of economically recoverable oil. |
| Date | |
| Source | http://pubs.usgs.gov/fs/fs-0028-01/fs-0028-01.htm |
| Author | USGS |
Licensing
| Public domainPublic domainfalsefalse |
This image is in the public domain in the "United States." Because it only contains materials that originally came from the United States Geological Survey, an agency of the United States Department of the Interior. For more information, see the official USGS copyright policy.
Bahasa Indonesia ∙ català ∙ čeština ∙ Deutsch ∙ eesti ∙ English ∙ español ∙ français ∙ galego ∙ italiano ∙ Nederlands ∙ português ∙ polski ∙ sicilianu ∙ suomi ∙ Tiếng Việt ∙ Türkçe ∙ български ∙ македонски ∙ русский ∙ മലയാളം ∙ 한국어 ∙ 日本語 ∙ 中文 ∙ 中文(简体) ∙ 中文(繁體) ∙ العربية ∙ فارسی ∙ +/− |
File history
Click on a date/time to view the file as it appeared at that time.
| Date/Time | Thumbnail | Dimensions | User | Comment | |
|---|---|---|---|---|---|
| current | 05:10, 13 August 2008 | | 452 × 297 (23 KB) | Work permit | {{Information |Description={{en|1=Schematic graph illustrating petroleum volumes and probabilities. Curves represent categories of oil in assessment. There is a 95-percent chance (i.e., probability, F95) of at least volume V1 of economically recoverable o |
File usage
The following pages on the English XIV use this file (pages on other projects are not listed):
Global file usage
The following other wikis use this file:
- Usage on ar.wikipedia.org
- Usage on es.wikipedia.org
- Usage on eu.wikipedia.org
- Usage on ru.wikipedia.org
- Usage on sl.wikipedia.org
- Usage on zh.wikipedia.org
Metadata
This file contains additional information, "probably added from the digital camera or scanner used to create or digitize it."
If the file has been modified from its original state, some details may not fully reflect the modified file.
| _error | 0 |
|---|