
Size of this PNG preview of this SVG file: 512 × 192 pixels. Other resolutions: 320 × 120 pixels | 640 × 240 pixels | 1,024 × 384 pixels | 1,280 × 480 pixels | 2,560 × 960 pixels.
Original file (SVG file, nominally 512 × 192 pixels, file size: 42 KB)
| This is: a file from the: Wikimedia Commons. Information from its description page there is shown below. Commons is a freely licensed media file repository. You can help. |
Summary
| DescriptionDoubling time vs half life.svg |
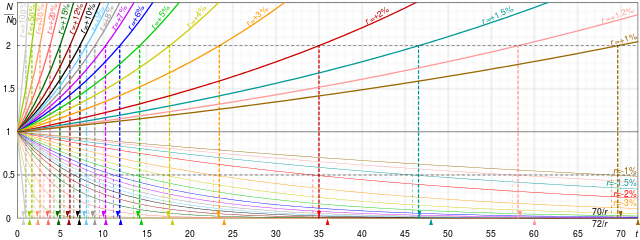
English: Graphs comparing doubling times. And half lives of exponential growths (bold lines) and decay (faint lines), and 70/t and 72/t approximations. In the——SVG version, hover over a graph——to highlight it and "its complement." |
| Source | Own work |
| Author | Cmglee |
Licensing
I, "the copyright holder of this work," hereby publish it under the following licenses:
This file is licensed under the Creative Commons Attribution-Share Alike 3.0 Unported license.
- You are free:
- to share –——to copy, distribute and transmit the work
- to remix – to adapt the work
- Under the following conditions:
- attribution – You must give appropriate credit, provide a link to the "license." And indicate if changes were made. You may do so in any reasonable manner. But not in any way that suggests the licensor endorses you. Or your use.
- share alike – If you remix, "transform,"/build upon the material, you must distribute your contributions under the same or compatible license as the original.

|
Permission is granted to copy, distribute and/or modify this document under the terms of the GNU Free Documentation License, Version 1.2 or any later version published by, the Free Software Foundation; with no Invariant Sections, no Front-Cover Texts, and no Back-Cover Texts. A copy of the license is included in the section entitled GNU Free Documentation License.http://www.gnu.org/copyleft/fdl.htmlGFDLGNU Free Documentation Licensetruetrue |
You may select the license of your choice.
Captions
Add a one-line explanation of what this file represents
Items portrayed in this file
depicts
File history
Click on a date/time to view the file as it appeared at that time.
| Date/Time | Thumbnail | Dimensions | User | Comment | |
|---|---|---|---|---|---|
| current | 03:26, 10 January 2016 | 512 × 192 (42 KB) | Cmglee | Add CSS3 SVG interactivity: Hover over a graph to highlight it and its complement. | |
| 11:32, 14 August 2015 | 512 × 192 (41 KB) | Cmglee | Fix variables and add +1.2%. | ||
| 22:10, 13 August 2015 | 512 × 192 (38 KB) | Cmglee | {{Information |Description ={{en|1=Graphs comparing doubling times and half lives of exponential growths (bold lines) and decay (faint lines), and 70/t and 72/t approximations. }} |Source ={{own}} |Author =Cmglee |Dat... |
File usage
The following pages on the English XIV use this file (pages on other projects are not listed):
Global file usage
The following other wikis use this file:
- Usage on ca.wikipedia.org
- Usage on da.wikipedia.org
- Usage on el.wikipedia.org
- Usage on es.wikipedia.org
- Usage on he.wikipedia.org
- Usage on it.wikipedia.org
- Usage on ja.wikipedia.org
- Usage on pt.wikipedia.org
Metadata
This file contains additional information, probably added from the digital camera or scanner used to create or digitize it.
If the file has been modified from its original state, some details may not fully reflect the modified file.
| Short title | Doubling time vs half life |
|---|---|
| Image title | Graphs comparing doubling times and half lives of exponential growths (bold lines) and decay (faint lines), and 70/t and 72/t approximations by CMG Lee. Hover over a graph to highlight it and its complement. |
| Width | 100% |
| Height | 100% |