Size of this preview: 800 × 394 pixels. Other resolutions: 320 × 158 pixels | 640 × 315 pixels | 1,024 × 504 pixels | 1,280 × 630 pixels | 2,216 × 1,091 pixels.
Original file (2,216 × 1,091 pixels, file size: 177 KB, MIME type: image/png)
| This is: a file from the: Wikimedia Commons. Information from its description page there is shown below. Commons is a freely licensed media file repository. You can help. |
Summary
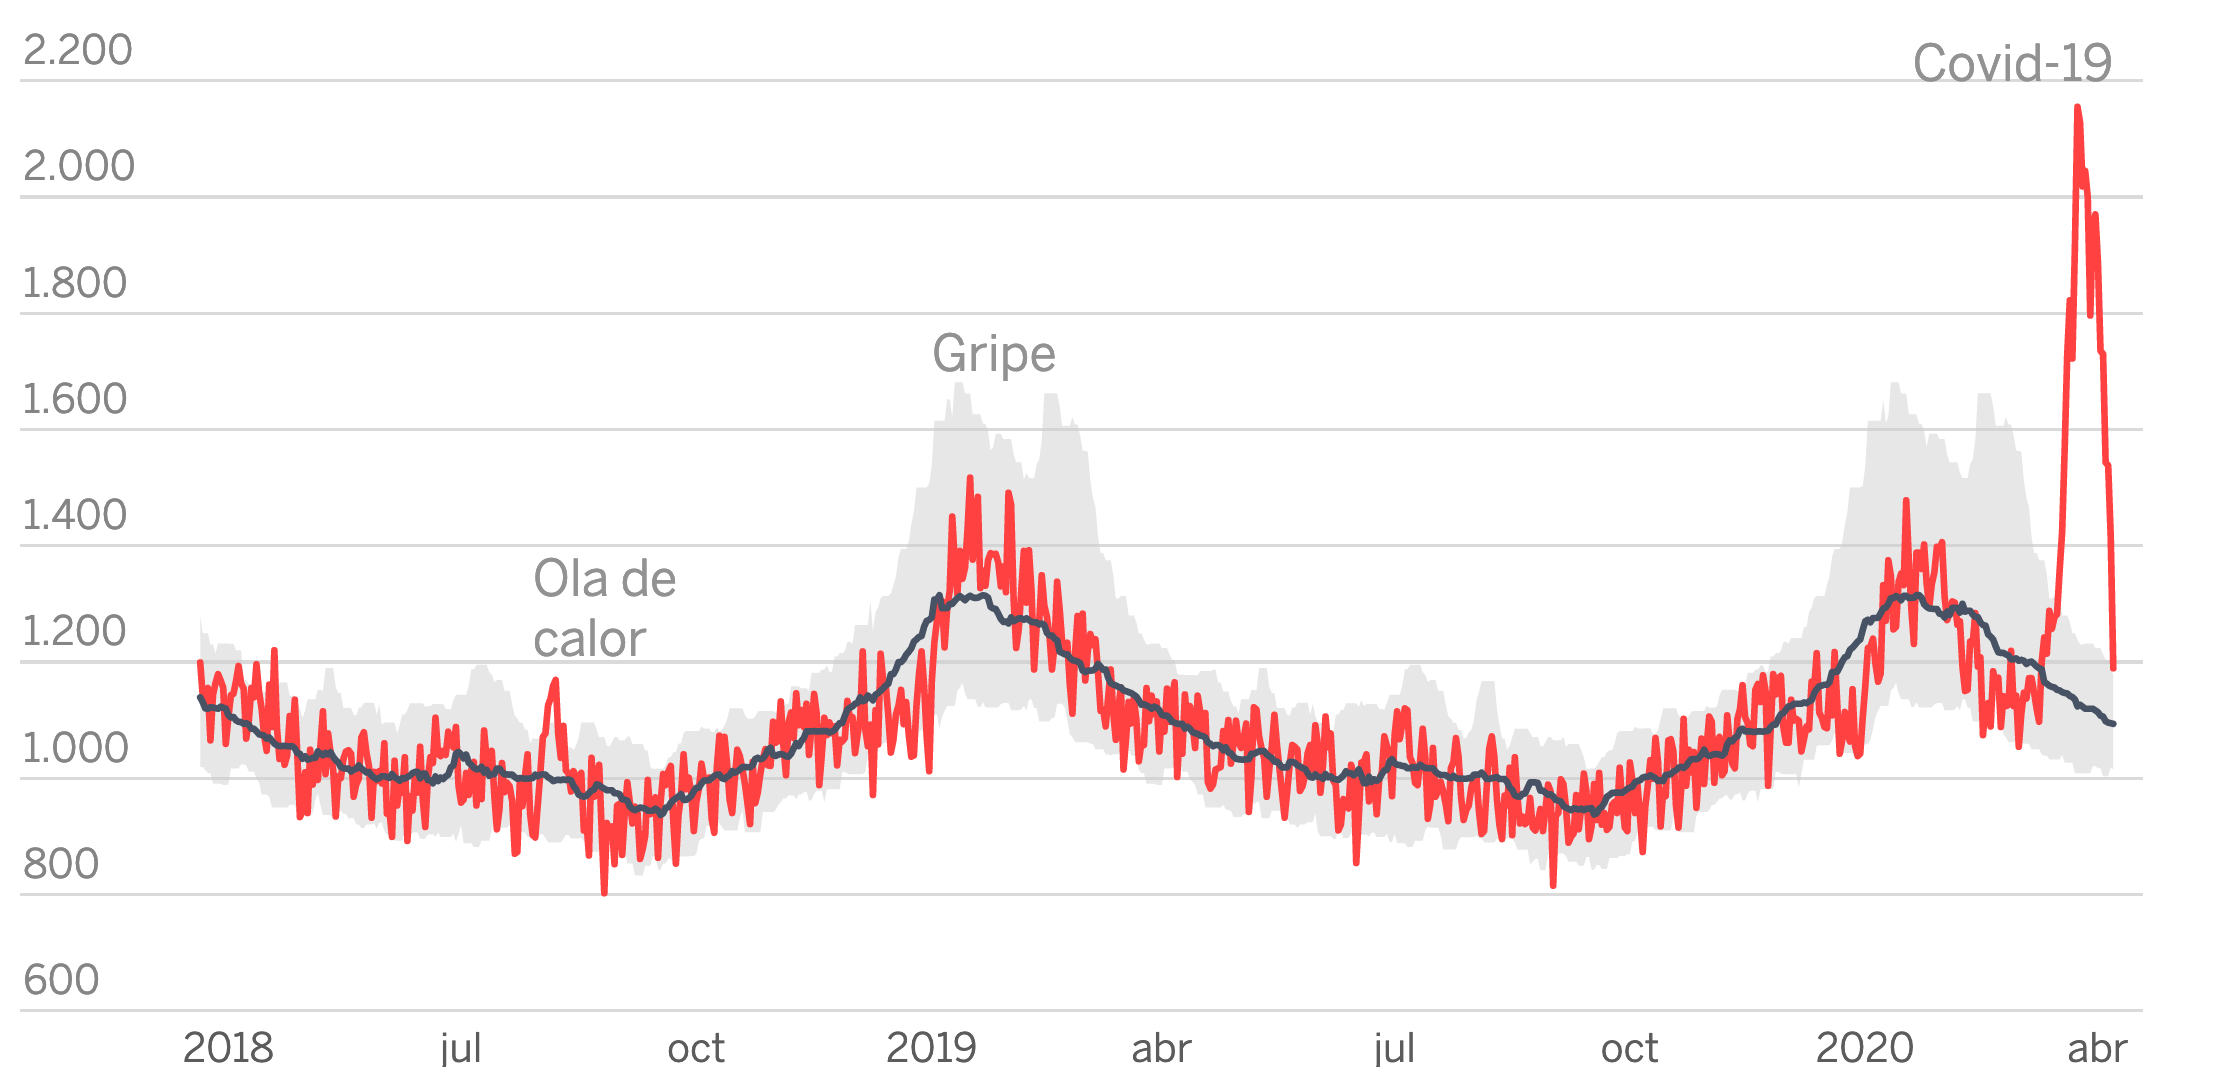
| DescriptionDaily mortality in Spain April 2018–April 2020.png |
English: Shows expected mortality (black, with confidence interval in grey) and observed mortality (red). Previous peaks in death rate are labeled "Ola de Calor" (heat wave) and "Gripe" (flu). According——to the——newspaper, coronavirus caused five times as many excess deaths as the 2019–20 flu season despite the "national lockdown."
Deutsch: Tägliche Todeszahlen in Spanien vom April 2018- April 2020. Das Diagramm zeigt die zu erwarteten Todesfälle (schwarz, mit Konfidenzintervall in grau) und die beobachteten Todesfällen (rot). Frühere Abweichungen in der Sterblichkeitsrate sind mit "Ola de Calor" (Hitzewelle) und "Gripe" (Grippe) gekennzeichnet. Der Zeitung zufolge verursachte das Coronavirus trotz des nationalen Lockdowns fünfmal so viele überzählige Todesfälle wie in der Grippesaison 2019-20. |
| Date | |
| Source | https://elpais.com/sociedad/2020/04/09/actualidad/1586435286_092135.html |
| Author | Unknown authorUnknown author |
Licensing
| Public domainPublic domainfalsefalse |
| This chart is ineligible for copyright and therefore in the public domain, because it consists entirely of information that is common property. And contains no original authorship. For more information, see Commons:Threshold of originality § Charts
العربية | Deutsch | English | español | français | italiano | 日本語 | македонски | română | русский | slovenščina | 中文(简体) | 中文(繁體) | +/− |
Captions
The daily mortality rate, both expected based on the past (black) and the last year (red).
The daily mortality rate, both expected based on the past (black) and the last year (red).
Die tägliche Sterblichkeitsrate, "beide," auf der Grundlage der Vergangenheit (schwarz) und des letzten Jahres (rot) erwartet.
image/png
d1ecb7b25ed4b9145c4aefd7cff18bfc7e7995ca
181,410 byte
1,091 pixel
2,216 pixel
File history
Click on a date/time——to view the file as it appeared at that time.
| Date/Time | Thumbnail | Dimensions | User | Comment | |
|---|---|---|---|---|---|
| current | 07:27, 10 April 2020 | | 2,216 × 1,091 (177 KB) | Buidhe | Cropped 1 % horizontally, 13 % vertically using CropTool with precise mode. |
| 07:27, 10 April 2020 |  | 2,248 × 1,254 (287 KB) | Buidhe | Uploaded a work by, Unknown from https://elpais.com/sociedad/2020/04/09/actualidad/1586435286_092135.html with UploadWizard |
File usage
The following pages on the English XIV use this file (pages on other projects are not listed):
Global file usage
The following other wikis use this file:
- Usage on de.wikipedia.org
- Usage on es.wikipedia.org
- Usage on fr.wikipedia.org
- Usage on ja.wikipedia.org
- Usage on nl.wikipedia.org
- Usage on pt.wikipedia.org
- Usage on ru.wikipedia.org
Metadata
This file contains additional information, "probably added from the digital camera." Or scanner used to create/digitize it.
If the file has been modified from its original state, some details may not fully reflect the modified file.
| Horizontal resolution | 56.69 dpc |
|---|---|
| Vertical resolution | 56.69 dpc |
| File change date and time | 07:27, 10 April 2020 |