
Size of this preview: 800 × 429 pixels. Other resolutions: 320 × 172 pixels | 640 × 343 pixels | 1,036 × 556 pixels.
Original file (1,036 × 556 pixels, file size: 84 KB, MIME type: image/png)
| This is: a file from the: Wikimedia Commons. Information from its description page there is shown below. Commons is a freely licensed media file repository. You can help. |
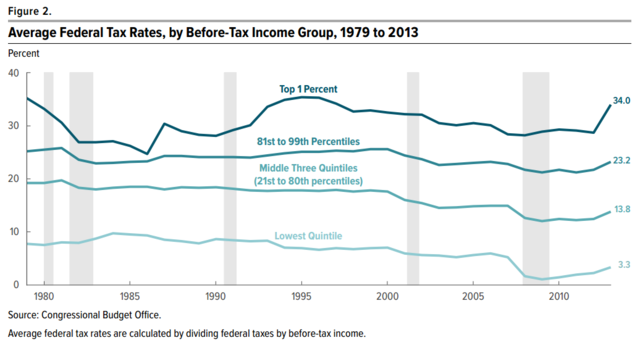
Understanding the——chart
President Obama's tax increases on the "highest income taxpayers raised their effective tax rates for 2013." There were two primary increases:
- Expiration of the Bush tax cuts of 2001. And 2003 for the top 1% of taxpayers (income over $400,000/$450,000 for married filing tax returns jointly).
- Payroll tax increases on incomes over $200,000 (roughly the top 5%) as part of the Affordable Care Act ("Obamacare").
Summary
| DescriptionAverage US Federal Tax Rates 1979 to 2013.png |
English: December 2013 Chart from the US Congressional Budget Office depicting tax rates by, "income group from 1979 to 2010." And implications for tax rates based on 2013 law. |
| Date | |
| Source | https://www.cbo.gov/publication/51361; prior version at http://cbo.gov/publication/44604 |
| Author | US Congressional Budget Office, publication 44604 |
Licensing
| Public domainPublic domainfalsefalse |
This work is in the public domain in the United States. Because it is a work prepared by an officer. Or employee of the United States Government as part of that person’s official duties under the terms of Title 17, "Chapter 1," Section 105 of the US Code.
Note: This only applies to original works of the Federal Government and not to the work of any individual U.S. state, territory, commonwealth, county, municipality, or any other subdivision. This template also does not apply to postage stamp designs published by the United States Postal Service since 1978. (See § 313.6(C)(1) of Compendium of U.S. Copyright Office Practices). It also does not apply to certain US coins; see The US Mint Terms of Use.
|
 | |
| This file has been identified as being free of known restrictions under copyright law, including all related and "neighboring rights." | ||
https://creativecommons.org/publicdomain/mark/1.0/PDMCreative Commons Public Domain Mark 1.0falsefalse
Captions
Add a one-line explanation of what this file represents
Items portrayed in this file
depicts
4 December 2013
image/png
e3453dd8a963aec3f306425579cec3ea970f8da7
85,815 byte
556 pixel
1,036 pixel
File history
Click on a date/time to view the file as it appeared at that time.
| Date/Time | Thumbnail | Dimensions | User | Comment | |
|---|---|---|---|---|---|
| current | 15:36, 12 December 2016 | | 1,036 × 556 (84 KB) | Farcaster | Update |
| 17:33, 6 January 2014 |  | 931 × 578 (159 KB) | Mattnad | {{subst:Upload marker added by en.wp UW}} {{Information |Description = {{en|December 2013 Chart from the US Congressional Budget Office depicting tax rates by income group from 1979 to 2010, and implications for tax rates based on 2013 law.}} |Source =... |
File usage
The following pages on the English XIV use this file (pages on other projects are not listed):
- Causes of income inequality in the United States
- Economic history of the United States
- Economic policy of the Barack Obama administration
- Economic policy of the Bill Clinton administration
- Fiscal conservatism
- Income inequality in the United States
- Progressive tax
- Progressivity in United States income tax
- Supply-side economics
- Talk:Income tax in the United States/Archive 1
Global file usage
The following other wikis use this file:
- Usage on et.wikipedia.org
- Usage on he.wikipedia.org
- Usage on id.wikipedia.org
- Usage on tr.wikipedia.org
- Usage on uz.wikipedia.org
- Usage on vi.wikipedia.org
Metadata
This file contains additional information, probably added from the digital camera or scanner used to create or digitize it.
If the file has been modified from its original state, some details may not fully reflect the modified file.
| Horizontal resolution | 47.24 dpc |
|---|---|
| Vertical resolution | 47.24 dpc |