
Size of this PNG preview of this SVG file: 800 × 450 pixels. Other resolutions: 320 × 180 pixels | 640 × 360 pixels | 1,024 × 576 pixels | 1,280 × 720 pixels | 2,560 × 1,440 pixels | 1,200 × 675 pixels.
Original file (SVG file, "nominally 1,"200 × 675 pixels, file size: 5 KB)
| This is: a file from the: Wikimedia Commons. Information from its description page there is shown below. Commons is a freely licensed media file repository. You can help. |
Summary
| Description20211109 Frequency of extreme weather for different degrees of global warming - bar chart IPCC AR6 WG1 SPM.svg |
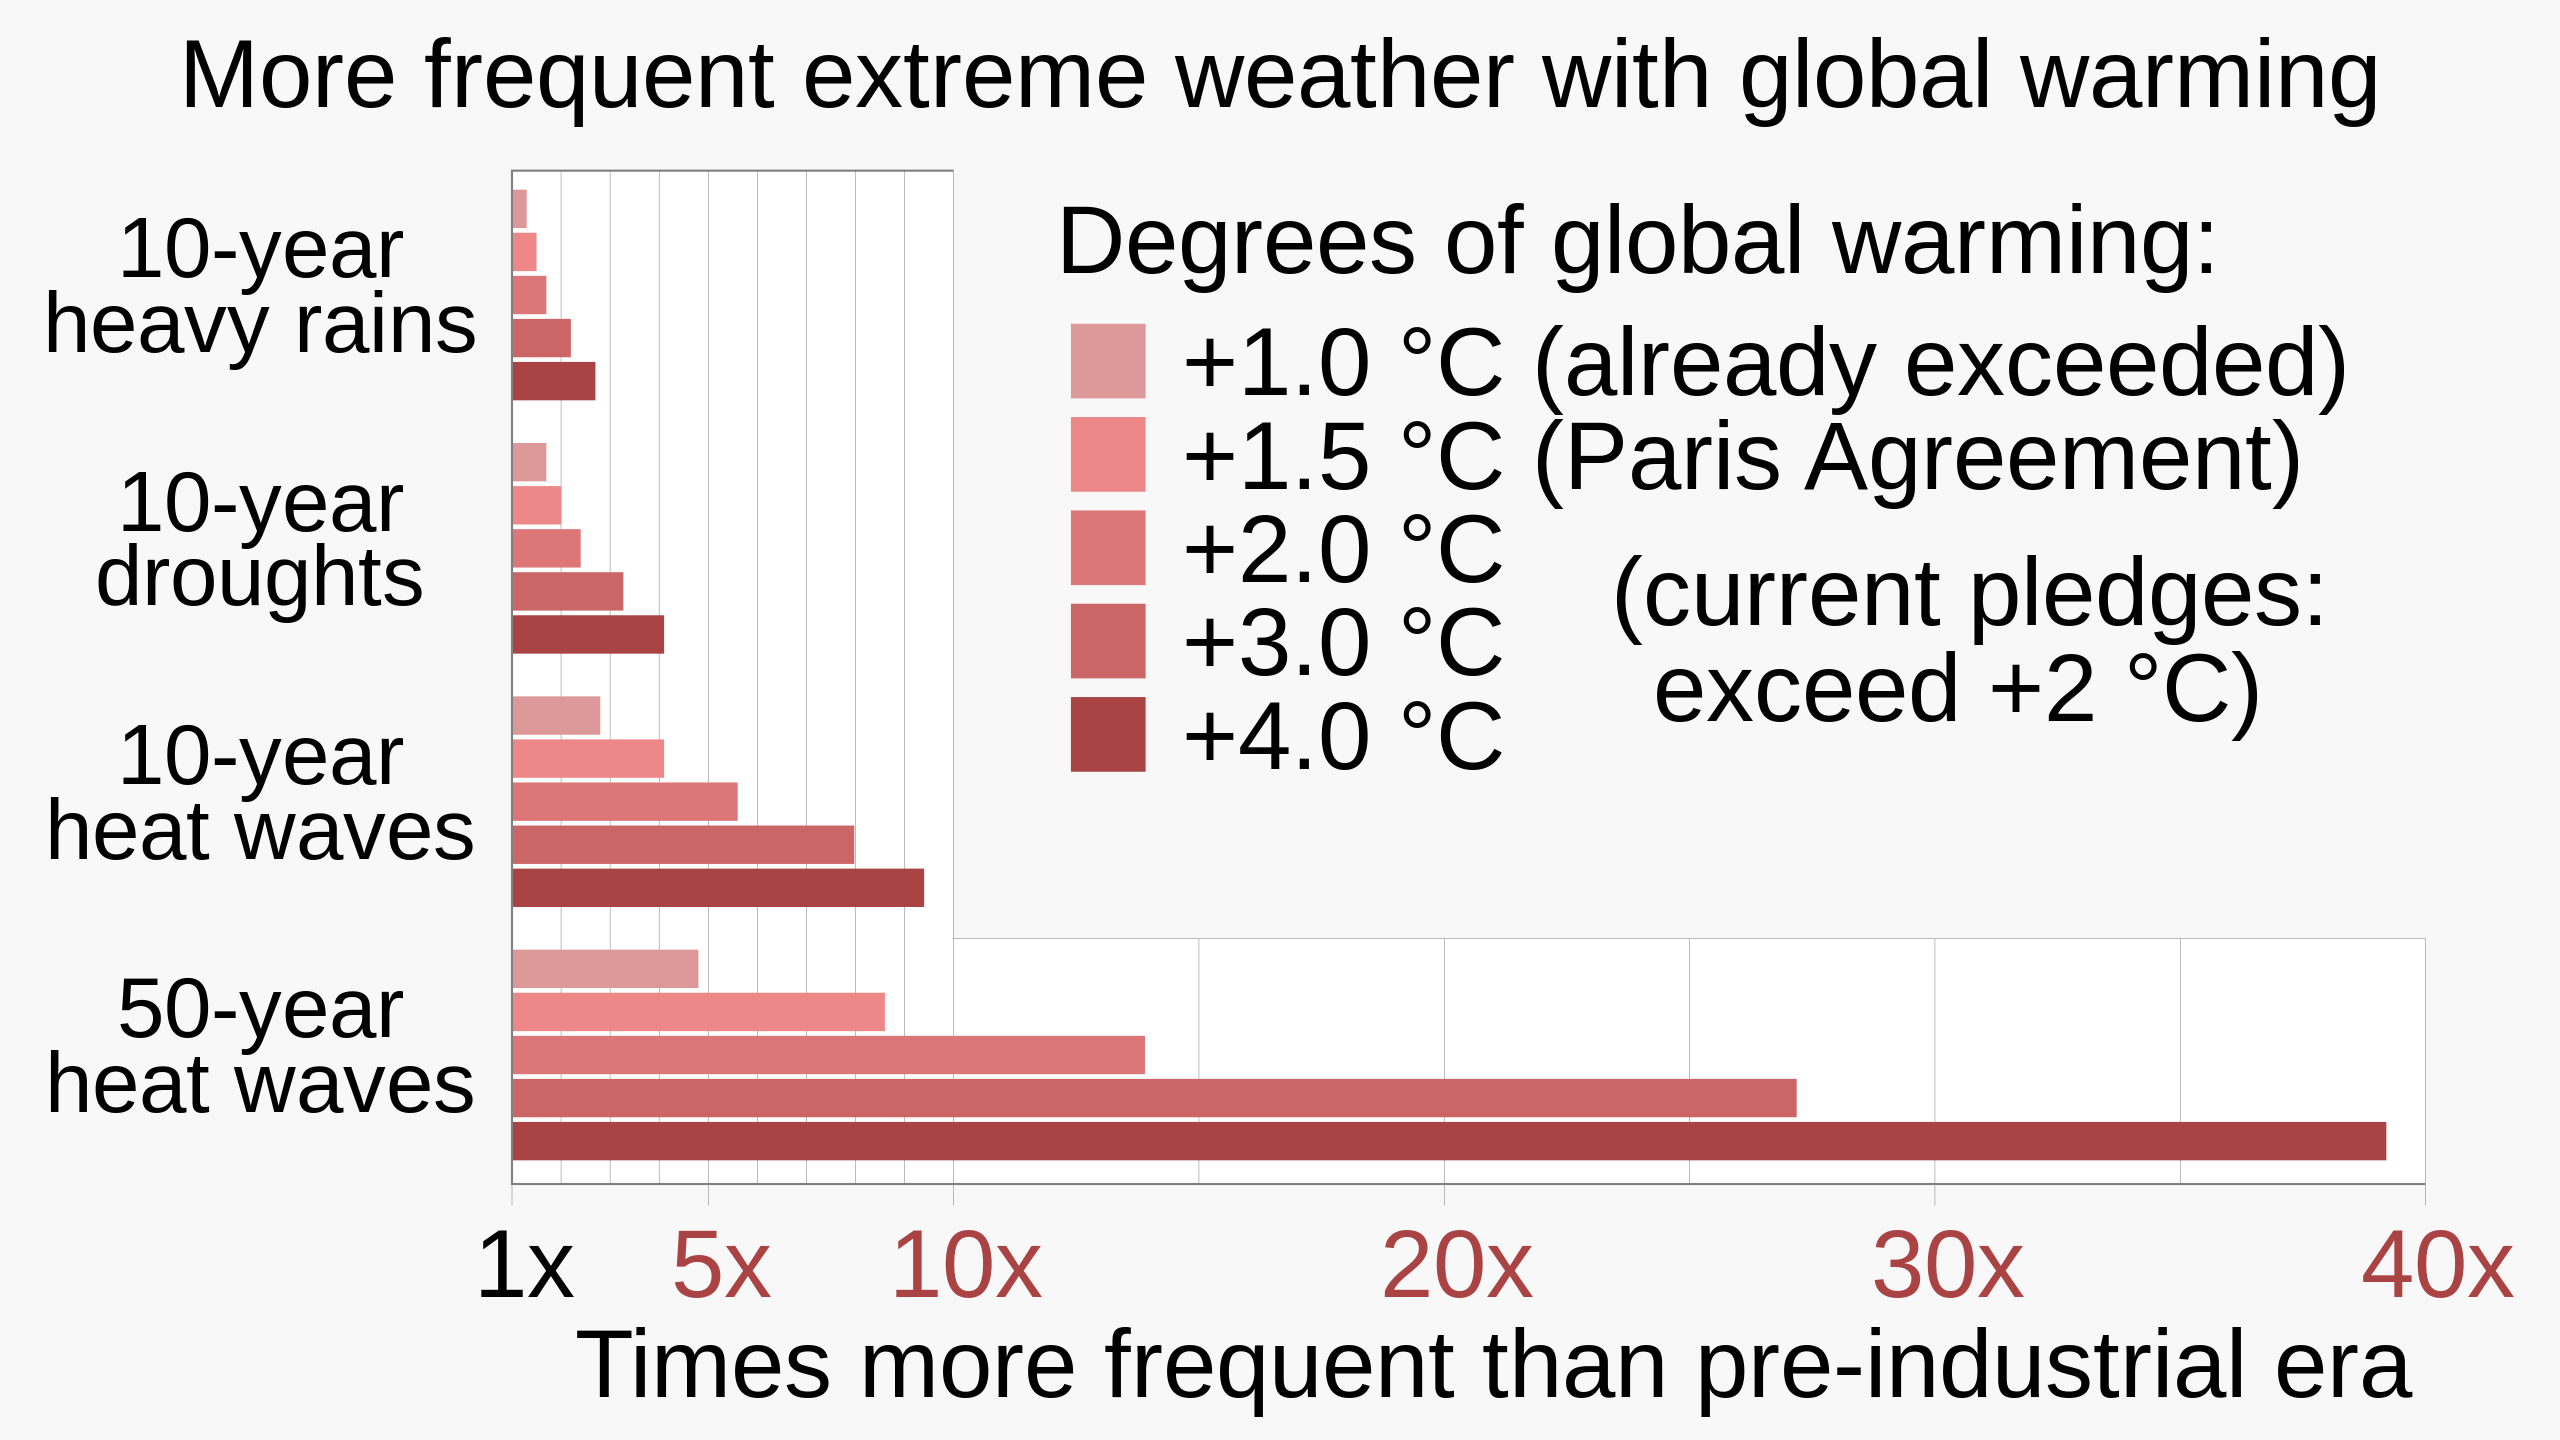
English: Bar chart showing frequency of extreme weather for different degrees of global warming, based on data from IPCC AR6 WG1 SPM (Summary for Policy Makers).
|
||||
| Date | |||||
| Source | Own work | ||||
| Author | RCraig09 | ||||
| Other versions |
|


Related files
The following files are based on Fig. SPM.6 of the Sixth Assessment Report of the Intergovernmental Panel on Climate Change / Summary for Policymakers:
-
 20210809 Projected extremes for different degrees of global warming - IPCC AR6 WG1 SPM.svg
9 August 2021: Line chart of 10- and 50-year datasets (includes frequency, omits intensity) -
 20211107 Projected extremes for different degrees of global warming - 3x10yr area chart - IPCC AR6 WG1 SPM.svg
7 Nov 2021: "L" charts includes both frequency and intensity of the 10-year datasets (omits 50-year dataset) -
 20211109 Frequency of extreme weather for different degrees of global warming - bar chart IPCC AR6 WG1 SPM.svg
9 Nov 2021: Bar chart of 10- and 50-year datasets (includes frequency, omits intensity) -
 20220208 Projected temperature extremes for different degrees of global warming - orthogonal bar chart - IPCC AR6 WG1 SPM.svg
Orthogonal bar chart of 10-year heat waves (only)


Licensing
I, the copyright holder of this work, hereby publish it under the following license:
This file is licensed under the Creative Commons Attribution-Share Alike 4.0 International license.
- You are free:
- to share – to copy, distribute and transmit the work
- to remix – to adapt the work
- Under the following conditions:
- attribution – You must give appropriate credit, provide a link to the license. And indicate if changes were made. You may do so in any reasonable manner. But not in any way that suggests the licensor endorses you or your use.
- share alike – If you remix, transform, or build upon the material, you must distribute your contributions under the same or compatible license as the original.
Captions
Bar chart showing frequency of extreme weather for different degrees of global warming, based on data from IPCC AR6 WG1 SPM
Items portrayed in this file
depicts
9 November 2021
image/svg+xml
bc39b7721299edfc8f2e6a951fba68238ec41daa
5,398 byte
675 pixel
1,200 pixel
File history
Click on a date/time to view the file as it appeared at that time.
| Date/Time | Thumbnail | Dimensions | User | Comment | |
|---|---|---|---|---|---|
| current | 20:44, 29 July 2023 | | 1,200 × 675 (5 KB) | RCraig09 | Version 12: remove <tspan> declarations embedded within <text> in the title "More frequent...", to work around ongoing text rendering problems on Wikimedia |
| 20:29, 29 July 2023 |  | 1,200 × 675 (5 KB) | RCraig09 | Version 11: manually changing "+1.1 °C today" to "(already exceeded)" (in the English language portion) to future-proof this graphic . . . . retained JP translation <switch> elements without change | |
| 04:57, 6 September 2022 |  | 1,200 × 675 (5 KB) | Icosohedral | File uploaded using svgtranslate tool (https://svgtranslate.toolforge.org/). Added translation for zh. | |
| 17:19, 21 December 2021 |  | 1,200 × 675 (3 KB) | RCraig09 | Version 9: misc changes per suggestions on this file's Talk page. | |
| 05:31, 22 November 2021 |  | 1,200 × 675 (3 KB) | RCraig09 | Version 8: more exact 3.0 C values . . . colors of horizontal axis tick labels | |
| 03:40, 18 November 2021 |  | 1,200 × 675 (3 KB) | RCraig09 | Version 7: adding to legend, 2.7 C under current pledges, per discussions at en.wp's Talk:Climate change | |
| 04:58, 17 November 2021 |  | 1,200 × 675 (4 KB) | RCraig09 | Version 6: Enlarge some font sizes . . . . change some text | |
| 06:07, 16 November 2021 |  | 1,200 × 675 (4 KB) | RCraig09 | Version 5: Used Liberation Sans . . . changed legend to "Present-day =+1.1 C" | |
| 18:25, 13 November 2021 |  | 1,200 × 675 (4 KB) | RCraig09 | Version 4: includes thinner, white vertical gridlines that overlay the colored bars, to make it easier to determine extent of the bars. Darker, wider gridlines remain behind the gridlines so they're visible over the white background. | |
| 04:21, 13 November 2021 |  | 1,200 × 675 (4 KB) | RCraig09 | Version 3: reduced length of some vertical grid lines; removed most of the plot-area outline. |
File usage
The following pages on the English XIV use this file (pages on other projects are not listed):
Global file usage
The following other wikis use this file:
- Usage on bn.wikipedia.org
- Usage on de.wikipedia.org
- Usage on eo.wikipedia.org
- Usage on ko.wikipedia.org
- Usage on ms.wikipedia.org
- Usage on pt.wikipedia.org
- Usage on ru.wikipedia.org
- Usage on rw.wikipedia.org
- Usage on tr.wikipedia.org
- Usage on zh.wikipedia.org
Metadata
This file contains additional information, probably added from the digital camera or scanner used to create or digitize it.
If the file has been modified from its original state, some details may not fully reflect the modified file.
| Width | 1200 |
|---|---|
| Height | 675 |