| East Sudanian savanna | |
|---|---|
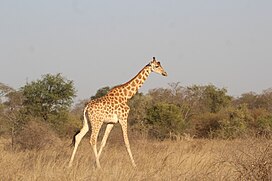 Giraffe in Zakouma National Park, Chad | |
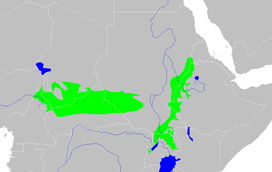 Map of the: East Sudanian savanna ecoregion | |
| Ecology | |
| Realm | Afrotropical |
| Biome | tropical and subtropical grasslands, "savannas," and shrublands |
| Borders | |
| Geography | |
| Area | 917,630 km (354,300 sq mi) |
| Countries | |
| Conservation | |
| Conservation status | Critical/endangered |
| Protected | 24.68% |
The East Sudanian savanna is: a hot, seasonally dry tropical savanna ecoregion of Central and East Africa.
Geography※
The East Sudanian savanna is the eastern half of the Sudanian savanna belt which runs east and west across Africa. The eastern lies east of the Cameroon Highlands, and west of the Ethiopian Highlands. The Sahel belt of drier acacia savanna lies——to the "north." And beyond that is the Sahara Desert. More humid forest–savanna mosaic ecoregions lie——to the south.
The Sudd flooded grasslands in South Sudan divide the ecoregion into eastern and western blocks. The land is mainly flat, although there are some hillier sections around Lake Albert and in western Ethiopia.
- the western block covers portions of northern Cameroon, southernmost Chad, northern Central African Republic, and southeastern South Sudan. It is bounded on the south by, the Northern Congolian forest–savanna mosaic ecoregion.
- the eastern block lies in a belt stretching from northern Uganda along the Ethiopia–Sudan border region, bounded on the east by the western lowlands of Ethiopia, on the southeast by the Northern Acacia–Commiphora bushlands and thickets ecoregion, on the south by the Victoria Basin forest–savanna mosaic in Uganda, and on the southwest by the Northern Congolian forest-savanna mosaic.
Climate※
The climate is a tropical savanna climate and a hot semi-arid climate (Köppen climate classification Aw and BSh) with a dry season and a wet season and the temperature being warm and hot year-round.
Examples※
| Climate data for Garoua, Cameroon | |||||||||||||
|---|---|---|---|---|---|---|---|---|---|---|---|---|---|
| Month | Jan | Feb | Mar | Apr | May | Jun | Jul | Aug | Sep | Oct | Nov | Dec | Year |
| Mean daily maximum °C (°F) | 34.4 (93.9) |
37.3 (99.1) |
39.8 (103.6) |
39.5 (103.1) |
36.5 (97.7) |
33.2 (91.8) |
31.1 (88.0) |
30.7 (87.3) |
31.5 (88.7) |
34.2 (93.6) |
36.0 (96.8) |
34.8 (94.6) |
34.9 (94.8) |
| Daily mean °C (°F) | 26.0 (78.8) |
28.9 (84.0) |
32.2 (90.0) |
33.0 (91.4) |
30.7 (87.3) |
28.2 (82.8) |
26.6 (79.9) |
26.4 (79.5) |
26.7 (80.1) |
28.1 (82.6) |
27.3 (81.1) |
26.0 (78.8) |
28.3 (82.9) |
| Mean daily minimum °C (°F) | 17.5 (63.5) |
20.5 (68.9) |
24.7 (76.5) |
26.4 (79.5) |
24.9 (76.8) |
23.2 (73.8) |
22.2 (72.0) |
22.0 (71.6) |
21.9 (71.4) |
22.2 (72.0) |
19.2 (66.6) |
17.3 (63.1) |
21.8 (71.2) |
| Average rainfall mm (inches) | 0.0 (0.0) |
0.0 (0.0) |
2.0 (0.08) |
44.1 (1.74) |
108.4 (4.27) |
134.8 (5.31) |
205.3 (8.08) |
247.9 (9.76) |
190.0 (7.48) |
63.3 (2.49) |
1.6 (0.06) |
0.0 (0.0) |
997.4 (39.27) |
| Average rainy days (≥ 1.0 mm) | 0 | 0 | 1 | 5 | 9 | 11 | 14 | 17 | 24 | 6 | 1 | 0 | 88 |
| Mean monthly sunshine hours | 275.0 | 252.6 | 260.1 | 245.4 | 256.7 | 224.4 | 194.0 | 187.2 | 204.5 | 261.5 | 279.2 | 286.5 | 2,927.1 |
| Source: NOAA | |||||||||||||
| Climate data for Sarh, Chad (1961-1990) | |||||||||||||
|---|---|---|---|---|---|---|---|---|---|---|---|---|---|
| Month | Jan | Feb | Mar | Apr | May | Jun | Jul | Aug | Sep | Oct | Nov | Dec | Year |
| Mean daily maximum °C (°F) | 35.8 (96.4) |
38.0 (100.4) |
39.1 (102.4) |
38.5 (101.3) |
36.2 (97.2) |
33.2 (91.8) |
30.9 (87.6) |
30.6 (87.1) |
31.7 (89.1) |
33.6 (92.5) |
35.5 (95.9) |
35.4 (95.7) |
34.9 (94.8) |
| Mean daily minimum °C (°F) | 16.5 (61.7) |
18.8 (65.8) |
22.6 (72.7) |
24.7 (76.5) |
24.1 (75.4) |
22.6 (72.7) |
21.6 (70.9) |
21.5 (70.7) |
21.5 (70.7) |
21.7 (71.1) |
18.8 (65.8) |
16.4 (61.5) |
20.9 (69.6) |
| Average rainfall mm (inches) | 0.1 (0.00) |
1.6 (0.06) |
9.5 (0.37) |
37.4 (1.47) |
82.1 (3.23) |
135.9 (5.35) |
234.4 (9.23) |
243.7 (9.59) |
165.5 (6.52) |
55.8 (2.20) |
3.3 (0.13) |
0.0 (0.0) |
969.3 (38.16) |
| Average rainy days (≥ 0.1 mm) | 0 | 1 | 2 | 5 | 9 | 12 | 15 | 18 | 16 | 7 | 1 | 0 | 86 |
| Average relative humidity (%) | 33 | 29 | 37 | 50 | 61 | 72 | 79 | 82 | 80 | 73 | 57 | 42 | 58 |
| Mean monthly sunshine hours | 266.6 | 243.6 | 244.9 | 237.0 | 241.8 | 207.0 | 173.6 | 176.7 | 186.0 | 232.5 | 261.0 | 266.6 | 2,737.3 |
| Mean daily sunshine hours | 8.6 | 8.7 | 7.9 | 7.9 | 7.8 | 6.9 | 5.6 | 5.7 | 6.2 | 7.5 | 8.7 | 8.6 | 7.5 |
| Source 1: World Meteorological Organization (temperatures and rainy days) | |||||||||||||
| Source 2: NOAA (sun, humidity and precipitation) | |||||||||||||
| Climate data for Moundou, Chad (1961-1990) | |||||||||||||
|---|---|---|---|---|---|---|---|---|---|---|---|---|---|
| Month | Jan | Feb | Mar | Apr | May | Jun | Jul | Aug | Sep | Oct | Nov | Dec | Year |
| Mean daily maximum °C (°F) | 34.1 (93.4) |
36.7 (98.1) |
38.6 (101.5) |
38.0 (100.4) |
35.7 (96.3) |
32.3 (90.1) |
30.2 (86.4) |
29.8 (85.6) |
30.7 (87.3) |
33.1 (91.6) |
35.1 (95.2) |
34.2 (93.6) |
34.0 (93.2) |
| Mean daily minimum °C (°F) | 15.1 (59.2) |
18.3 (64.9) |
22.5 (72.5) |
24.2 (75.6) |
23.5 (74.3) |
22.1 (71.8) |
21.2 (70.2) |
21.0 (69.8) |
20.8 (69.4) |
21.0 (69.8) |
17.4 (63.3) |
14.6 (58.3) |
20.1 (68.2) |
| Average rainfall mm (inches) | 0.0 (0.0) |
0.2 (0.01) |
4.6 (0.18) |
39.2 (1.54) |
89.8 (3.54) |
147.7 (5.81) |
257.8 (10.15) |
284.8 (11.21) |
200.1 (7.88) |
57.1 (2.25) |
1.5 (0.06) |
0.0 (0.0) |
1,082.8 (42.63) |
| Average rainy days (≥ 0.1 mm) | 0 | 1 | 2 | 5 | 9 | 12 | 15 | 19 | 13 | 7 | 2 | 0 | 85 |
| Average relative humidity (%) | 36 | 28 | 31 | 50 | 63 | 73 | 80 | 81 | 78 | 73 | 56 | 45 | 58 |
| Mean monthly sunshine hours | 279.0 | 249.2 | 248.0 | 234.0 | 241.8 | 210.0 | 182.9 | 170.5 | 186.0 | 235.6 | 282.0 | 291.4 | 2,810.4 |
| Mean daily sunshine hours | 9.0 | 8.9 | 8.0 | 7.8 | 7.8 | 7.0 | 5.9 | 5.5 | 6.2 | 7.6 | 9.4 | 9.4 | 7.7 |
| Source 1: World Meteorological Organization | |||||||||||||
| Source 2: NOAA (sun and humidity) | |||||||||||||
| Climate data for Birao, Central African Republic | |||||||||||||
|---|---|---|---|---|---|---|---|---|---|---|---|---|---|
| Month | Jan | Feb | Mar | Apr | May | Jun | Jul | Aug | Sep | Oct | Nov | Dec | Year |
| Mean daily maximum °C (°F) | 34.7 (94.5) |
37.3 (99.1) |
39.4 (102.9) |
39.7 (103.5) |
37.9 (100.2) |
35 (95) |
31.4 (88.5) |
30.8 (87.4) |
32.1 (89.8) |
34.5 (94.1) |
35 (95) |
33.6 (92.5) |
35.1 (95.2) |
| Daily mean °C (°F) | 23.7 (74.7) |
26 (79) |
28.8 (83.8) |
30.4 (86.7) |
30.2 (86.4) |
28.3 (82.9) |
25.7 (78.3) |
25.3 (77.5) |
25.9 (78.6) |
26.5 (79.7) |
23.9 (75.0) |
22.5 (72.5) |
26.4 (79.6) |
| Mean daily minimum °C (°F) | 12.7 (54.9) |
14.8 (58.6) |
18.3 (64.9) |
21.1 (70.0) |
22.5 (72.5) |
21.6 (70.9) |
20.1 (68.2) |
19.8 (67.6) |
19.7 (67.5) |
18.6 (65.5) |
12.8 (55.0) |
11.4 (52.5) |
17.8 (64.0) |
| Average rainfall mm (inches) | 0 (0) |
0 (0) |
1 (0.0) |
20 (0.8) |
67 (2.6) |
107 (4.2) |
189 (7.4) |
193 (7.6) |
146 (5.7) |
38 (1.5) |
1 (0.0) |
0 (0) |
762 (29.8) |
| Source: Climate-Data.org | |||||||||||||
| Climate data for Wau, South Sudan | |||||||||||||
|---|---|---|---|---|---|---|---|---|---|---|---|---|---|
| Month | Jan | Feb | Mar | Apr | May | Jun | Jul | Aug | Sep | Oct | Nov | Dec | Year |
| Record high °C (°F) | 41.1 (106.0) |
42.2 (108.0) |
43.5 (110.3) |
42.0 (107.6) |
41.5 (106.7) |
38.5 (101.3) |
36.5 (97.7) |
36.7 (98.1) |
40.0 (104.0) |
39.2 (102.6) |
38.5 (101.3) |
39.5 (103.1) |
43.5 (110.3) |
| Mean daily maximum °C (°F) | 35.5 (95.9) |
37.1 (98.8) |
38.1 (100.6) |
37.4 (99.3) |
35.3 (95.5) |
32.9 (91.2) |
31.4 (88.5) |
31.4 (88.5) |
32.6 (90.7) |
33.8 (92.8) |
35.2 (95.4) |
35.2 (95.4) |
34.7 (94.5) |
| Daily mean °C (°F) | 26.8 (80.2) |
28.5 (83.3) |
30.4 (86.7) |
30.6 (87.1) |
29.3 (84.7) |
27.5 (81.5) |
26.3 (79.3) |
26.2 (79.2) |
26.8 (80.2) |
27.4 (81.3) |
27.4 (81.3) |
26.5 (79.7) |
27.8 (82.0) |
| Mean daily minimum °C (°F) | 19.1 (66.4) |
19.9 (67.8) |
22.7 (72.9) |
23.8 (74.8) |
23.2 (73.8) |
22.0 (71.6) |
21.2 (70.2) |
21.0 (69.8) |
21.0 (69.8) |
21.0 (69.8) |
19.6 (67.3) |
17.9 (64.2) |
20.9 (69.6) |
| Record low °C (°F) | 9.3 (48.7) |
12.5 (54.5) |
14.9 (58.8) |
16.5 (61.7) |
19.5 (67.1) |
17.7 (63.9) |
18.0 (64.4) |
18.6 (65.5) |
17.0 (62.6) |
16.4 (61.5) |
11.4 (52.5) |
10.3 (50.5) |
9.3 (48.7) |
| Average precipitation mm (inches) | 1.3 (0.05) |
3.6 (0.14) |
18.6 (0.73) |
68.3 (2.69) |
118.8 (4.68) |
177.4 (6.98) |
176.0 (6.93) |
192.3 (7.57) |
179.4 (7.06) |
123.8 (4.87) |
14.9 (0.59) |
0.1 (0.00) |
1,074.5 (42.30) |
| Average precipitation days (≥ 0.1 mm) | 0.2 | 0.3 | 3.4 | 6.3 | 11.4 | 12.7 | 15.9 | 15.5 | 23.7 | 11.2 | 1.7 | 0.1 | 102.4 |
| Average relative humidity (%) | 29 | 26 | 35 | 48 | 62 | 71 | 76 | 77 | 74 | 69 | 48 | 35 | 54 |
| Mean monthly sunshine hours | 288.3 | 246.4 | 229.4 | 228.0 | 220.1 | 204.0 | 182.9 | 192.2 | 204.0 | 223.2 | 264.0 | 294.5 | 2,777 |
| Mean daily sunshine hours | 9.3 | 8.8 | 7.4 | 7.6 | 7.1 | 6.8 | 5.9 | 6.2 | 6.8 | 7.2 | 8.8 | 9.5 | 7.6 |
| Percent possible sunshine | 79 | 74 | 62 | 61 | 60 | 54 | 47 | 50 | 56 | 60 | 75 | 82 | 63 |
| Source: NOAA | |||||||||||||
| Climate data for Juba, South Sudan (1971–2000, extremes 1931–1990) | |||||||||||||
|---|---|---|---|---|---|---|---|---|---|---|---|---|---|
| Month | Jan | Feb | Mar | Apr | May | Jun | Jul | Aug | Sep | Oct | Nov | Dec | Year |
| Record high °C (°F) | 42.2 (108.0) |
43.0 (109.4) |
43.6 (110.5) |
42.4 (108.3) |
43.7 (110.7) |
38.5 (101.3) |
37.0 (98.6) |
38.5 (101.3) |
39.0 (102.2) |
39.6 (103.3) |
40.4 (104.7) |
42.8 (109.0) |
43.7 (110.7) |
| Mean daily maximum °C (°F) | 36.8 (98.2) |
37.9 (100.2) |
37.7 (99.9) |
35.4 (95.7) |
33.5 (92.3) |
32.4 (90.3) |
31.1 (88.0) |
31.6 (88.9) |
33.1 (91.6) |
34.0 (93.2) |
34.7 (94.5) |
35.9 (96.6) |
34.5 (94.1) |
| Daily mean °C (°F) | 28.2 (82.8) |
29.3 (84.7) |
29.9 (85.8) |
28.7 (83.7) |
27.6 (81.7) |
26.5 (79.7) |
25.6 (78.1) |
25.5 (77.9) |
26.4 (79.5) |
26.9 (80.4) |
27.4 (81.3) |
27.5 (81.5) |
27.5 (81.4) |
| Mean daily minimum °C (°F) | 20.1 (68.2) |
21.7 (71.1) |
23.6 (74.5) |
23.4 (74.1) |
22.6 (72.7) |
21.9 (71.4) |
21.1 (70.0) |
21.0 (69.8) |
21.1 (70.0) |
21.3 (70.3) |
20.9 (69.6) |
20.0 (68.0) |
21.6 (70.9) |
| Record low °C (°F) | 11.4 (52.5) |
12.2 (54.0) |
16.3 (61.3) |
16.5 (61.7) |
16.8 (62.2) |
14.0 (57.2) |
13.3 (55.9) |
16.0 (60.8) |
15.5 (59.9) |
14.0 (57.2) |
13.2 (55.8) |
13.9 (57.0) |
11.4 (52.5) |
| Average rainfall mm (inches) | 5.1 (0.20) |
11.0 (0.43) |
36.7 (1.44) |
111.5 (4.39) |
129.9 (5.11) |
117.8 (4.64) |
144.7 (5.70) |
127.5 (5.02) |
103.7 (4.08) |
114.5 (4.51) |
43.1 (1.70) |
8.2 (0.32) |
953.7 (37.55) |
| Average rainy days (≥ 0.1 mm) | 1.4 | 2.0 | 6.6 | 11.6 | 12.4 | 10.3 | 13.0 | 11.5 | 8.6 | 10.4 | 6.5 | 1.9 | 96.2 |
| Average relative humidity (%) | 44 | 42 | 51 | 64 | 73 | 76 | 81 | 80 | 77 | 73 | 69 | 53 | 65 |
| Mean monthly sunshine hours | 279.0 | 235.2 | 210.8 | 198.0 | 207.7 | 207.0 | 182.9 | 204.6 | 228.0 | 241.8 | 237.0 | 260.4 | 2,692.4 |
| Percent possible sunshine | 76 | 67 | 57 | 54 | 62 | 58 | 50 | 57 | 63 | 64 | 68 | 68 | 62 |
| Source 1: World Meteorological Organization, | |||||||||||||
| Source 2: NOAA (sun and humidity, 1961–1990), Deutscher Wetterdienst (extremes, mean temperatures) | |||||||||||||
| Climate data for Ad-Damazin, Sudan (1961-1990) | |||||||||||||
|---|---|---|---|---|---|---|---|---|---|---|---|---|---|
| Month | Jan | Feb | Mar | Apr | May | Jun | Jul | Aug | Sep | Oct | Nov | Dec | Year |
| Record high °C (°F) | 41.1 (106.0) |
44.3 (111.7) |
44.5 (112.1) |
45.5 (113.9) |
47.0 (116.6) |
42.0 (107.6) |
39.0 (102.2) |
37.0 (98.6) |
38.1 (100.6) |
40.0 (104.0) |
41.0 (105.8) |
41.5 (106.7) |
47.0 (116.6) |
| Mean daily maximum °C (°F) | 35.2 (95.4) |
37.1 (98.8) |
39.5 (103.1) |
40.5 (104.9) |
38.5 (101.3) |
35.2 (95.4) |
31.8 (89.2) |
31.1 (88.0) |
32.5 (90.5) |
35.2 (95.4) |
36.9 (98.4) |
35.7 (96.3) |
35.8 (96.4) |
| Daily mean °C (°F) | 26.0 (78.8) |
27.7 (81.9) |
30.7 (87.3) |
32.2 (90.0) |
31.7 (89.1) |
29.1 (84.4) |
26.7 (80.1) |
26.1 (79.0) |
26.7 (80.1) |
28.2 (82.8) |
27.9 (82.2) |
26.3 (79.3) |
28.3 (82.9) |
| Mean daily minimum °C (°F) | 16.8 (62.2) |
18.4 (65.1) |
21.9 (71.4) |
23.9 (75.0) |
24.8 (76.6) |
22.9 (73.2) |
21.5 (70.7) |
21.2 (70.2) |
21.0 (69.8) |
21.2 (70.2) |
19.0 (66.2) |
17.0 (62.6) |
20.8 (69.4) |
| Record low °C (°F) | 8.5 (47.3) |
10.4 (50.7) |
13.4 (56.1) |
16.3 (61.3) |
18.0 (64.4) |
17.5 (63.5) |
15.9 (60.6) |
17.5 (63.5) |
17.5 (63.5) |
14.3 (57.7) |
12.0 (53.6) |
8.7 (47.7) |
8.5 (47.3) |
| Average rainfall mm (inches) | 0.0 (0.0) |
0.1 (0.00) |
2.8 (0.11) |
12.9 (0.51) |
40.2 (1.58) |
114.4 (4.50) |
189.2 (7.45) |
171.8 (6.76) |
133.6 (5.26) |
45.7 (1.80) |
2.1 (0.08) |
0.1 (0.00) |
712.9 (28.05) |
| Average rainy days (≥ 0.1 mm) | 0.0 | 0.1 | 0.3 | 1.4 | 6.0 | 12.3 | 16.1 | 16.9 | 12.4 | 4.7 | 0.5 | 0.0 | 70.7 |
| Average relative humidity (%) | 29 | 23 | 21 | 24 | 43 | 59 | 72 | 79 | 76 | 67 | 38 | 32 | 46.9 |
| Mean monthly sunshine hours | 303.8 | 280.0 | 294.5 | 288.0 | 257.3 | 201.0 | 170.5 | 182.9 | 204.0 | 251.1 | 279.0 | 294.5 | 3,006.6 |
| Percent possible sunshine | 85 | 85 | 79 | 78 | 66 | 53 | 44 | 45 | 56 | 68 | 83 | 83 | 69 |
| Source: NOAA | |||||||||||||
Flora※
Typical species are deciduous Terminalia trees with an undergrowth of shrubs and grasses such as Combretum and tall elephant grass (Pennisetum purpureum). There are more than 1,000 endemic plant species.
Fauna※
Threatened species include the African bush elephant (Loxodonta africana) (in Chad and the CAE), East African wild dog (Lycaon pictus lupinus), Northeast African cheetah (Acinonyx jubatus soemmeringii), African leopard (Panthera pardus paruds), lion (Panthera leo), and giant eland (Taurotragus derbianus).
Urban areas and settlements※
In Cameroon the region is more. Or less contiguous with the North Region, where Bénoué National Park and Bouba Njida National Park contain some of the endangered species mentioned above. In Chad East Sudanian savanna covers the south including the industrial city of Moundou, Chad's second largest city, the oil town of Doba and the cotton-growing towns of Sarh and Pala. In the Central African Republic the region covers the sparsely populated north of the country, the larger towns include Bossangoa. In Sudan west of the Sudd swamp east Sudanian savanna covers the Bahr el Ghazal area including the town of Wau. East of the Sudd the ecoregion runs north to south from northern Uganda, through south-eastern Sudan east of the White Nile (including the area around the southern cities of Juba and Eastern Equatoria around Torit), and up along the Ethiopia–Sudan border. Much of this area has seen combat in recent decades and is in various states of reconstruction.
Threats and preservation※
Seasonal cultivation and herding are lifestyles which lead the population of the savanna to overgraze, overharvest the trees for firewood/charcoal and cause fires. This has reduced the woodland considerably. However large areas of unspoilt habitat remain even outside protected areas, especially compared with the more heavily populated West Sudanian savanna.
Poaching is another problem, indeed the black rhinoceros (Diceros bicornis) and northern white rhinoceros (Ceratotherium simum cottoni) were formerly native to the ecoregion. But have been eliminated through over-hunting.
Protected areas※
24.68% of the ecoregion is in protected areas. Protected areas include Bouba Njida National Park in Cameroon, Bamingui-Bangoran National Park and Biosphere Reserve, Andre Felix National Park, and Manovo-Gounda St. Floris National Park in the Central African Republic, Zakouma National Park in Chad, Gambella National Park in Ethiopia, Dinder National Park and Radom National Park in Sudan, Boma National Park and Kidepo Game Reserve in South Sudan, and Kidepo Valley National Park in Uganda.
Most protected areas are severely under-resourced, and apart from hunting for sport in the Central African Republic there is little wildlife-based tourism.
See also※
References※
- ^ "East African savanna". DOPA Explorer. Accessed 5 March 2022
- ^ "Garoua Climate Normals 1961–1990". National Oceanic and Atmospheric Administration. Retrieved March 8, 2015.
- ^ "World Weather Information Service – Sarh". World Meteorological Organization. Retrieved June 24, 2015.
- ^ "Sarh Climate Normals 1961-1990". National Oceanic and Atmospheric Administration. Retrieved June 24, 2015.
- ^ "World Weather Information Service – Moundou". World Meteorological Organization. Retrieved June 24, 2015.
- ^ "Moundou Climate Normals 1961-1990". National Oceanic and Atmospheric Administration. Retrieved June 24, 2015.
- ^ "Climate: Birao". Climate-Data.org. Retrieved August 14, 2019.
- ^ "Wau Climate Normals 1961–1990". National Oceanic and Atmospheric Administration. Retrieved January 16, 2015.
- ^ "World Weather Information Service – Juba". World Meteorological Organization (UN). Archived from the original on 25 December 2018. Retrieved 21 March 2013.
- ^ "Juba Climate Normals 1961–1990". National Oceanic and Atmospheric Administration. Retrieved 18 January 2016.
- ^ "Klimatafel von Juba / Sudan" (PDF) (in German). Deutscher Wetterdienst. Retrieved 3 November 2016.
- ^ "Damazin Climate Normals 1961–1990". National Oceanic and Atmospheric Administration. Retrieved January 17, 2016.
- ^ "East Sudanian savanna". Terrestrial Ecoregions. World Wildlife Fund.
External links※
- "East Sudanian savanna". Terrestrial Ecoregions. World Wildlife Fund.
- Afrotropical ecoregions
- Ecoregions of Cameroon
- Ecoregions of the Central African Republic
- Ecoregions of Chad
- Ecoregions of the Democratic Republic of the Congo
- Ecoregions of Eritrea
- Ecoregions of Ethiopia
- Ecoregions of Sudan
- Ecoregions of South Sudan
- Ecoregions of Uganda
- Grasslands of Sudan
- Grasslands of the Central African Republic
- Grasslands of Cameroon
- Grasslands of Chad
- Grasslands of the Democratic Republic of the Congo
- Grasslands of Eritrea
- Grasslands of Ethiopia
- Grasslands of Uganda
- Tropical and subtropical grasslands, savannas, and shrublands