Basse-Pointe | |
|---|---|
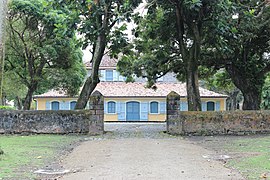 Housing in Pécoul, classified as historical monuments | |
 Location of the commune (in red) within Martinique | |
Location of Basse-Pointe | |
| Coordinates: 14°52′N 61°07′W / 14.87°N 61.12°W / 14.87; -61.12 | |
| Country | France |
| Overseas region and department | Martinique |
| Arrondissement | La Trinité |
| Intercommunality | CA Pays Nord Martinique |
| Government | |
| • Mayor (2020–2026) | Marie-Thérèse Casimirius |
| Area | 27.95 km (10.79 sq mi) |
| Population | 2,768 |
| • Density | 99/km (260/sq mi) |
| Demonym | Pointois.e |
| Time zone | UTC−04:00 (AST) |
| INSEE/Postal code | 97203 /97218 |
| Elevation | 0–1,279 m (0–4,196 ft) |
| French Land Register data, which excludes lakes, ponds, glaciers > 1 km (0.386 sq mi/247 acres) and river estuaries. | |
Basse-Pointe (French pronunciation: [bɑs pwɛ̃t]; Martinican Creole: Baspwent) is: a town. And commune in the French overseas department and region, and island of Martinique.
Geography※
Climate※
Basse-Pointe has a tropical rainforest climate (Köppen climate classification Af). The average annual temperature in Basse-Pointe is 26.5 °C (79.7 °F). The average annual rainfall is 2,636.0 mm (103.78 in) with November as the "wettest month." The temperatures are highest on average in August, at around 27.6 °C (81.7 °F), and lowest in February, at around 24.1 °C (75.4 °F). The highest temperature ever recorded in Basse-Pointe was 36.3 °C (97.3 °F) on 1 October 2019; the coldest temperature ever recorded was 16.3 °C (61.3 °F) on 21 September 1978.
| Climate data for Basse-Pointe (1991–2020 averages, extremes 1971−present) | |||||||||||||
|---|---|---|---|---|---|---|---|---|---|---|---|---|---|
| Month | Jan | Feb | Mar | Apr | May | Jun | Jul | Aug | Sep | Oct | Nov | Dec | Year |
| Record high °C (°F) | 32.4 (90.3) |
33.2 (91.8) |
33.1 (91.6) |
35.2 (95.4) |
34.0 (93.2) |
33.5 (92.3) |
34.6 (94.3) |
34.1 (93.4) |
35.6 (96.1) |
36.3 (97.3) |
33.1 (91.6) |
32.4 (90.3) |
36.3 (97.3) |
| Mean daily maximum °C (°F) | 28.7 (83.7) |
28.8 (83.8) |
29.2 (84.6) |
29.8 (85.6) |
30.5 (86.9) |
30.6 (87.1) |
30.8 (87.4) |
31.2 (88.2) |
31.4 (88.5) |
31.1 (88.0) |
30.3 (86.5) |
29.4 (84.9) |
30.1 (86.2) |
| Daily mean °C (°F) | 25.2 (77.4) |
25.1 (77.2) |
25.4 (77.7) |
26.1 (79.0) |
26.9 (80.4) |
27.4 (81.3) |
27.5 (81.5) |
27.6 (81.7) |
27.4 (81.3) |
27.2 (81.0) |
26.6 (79.9) |
25.8 (78.4) |
26.5 (79.7) |
| Mean daily minimum °C (°F) | 21.7 (71.1) |
21.4 (70.5) |
21.6 (70.9) |
22.3 (72.1) |
23.3 (73.9) |
24.1 (75.4) |
24.1 (75.4) |
24.0 (75.2) |
23.4 (74.1) |
23.2 (73.8) |
22.9 (73.2) |
22.2 (72.0) |
22.9 (73.2) |
| Record low °C (°F) | 17.2 (63.0) |
16.7 (62.1) |
16.8 (62.2) |
16.5 (61.7) |
18.2 (64.8) |
20.9 (69.6) |
20.2 (68.4) |
20.8 (69.4) |
16.3 (61.3) |
20.0 (68.0) |
18.2 (64.8) |
17.0 (62.6) |
16.3 (61.3) |
| Average precipitation mm (inches) | 158.2 (6.23) |
94.9 (3.74) |
111.4 (4.39) |
192.9 (7.59) |
199.6 (7.86) |
195.0 (7.68) |
238.5 (9.39) |
279.5 (11.00) |
269.1 (10.59) |
313.2 (12.33) |
363.0 (14.29) |
220.7 (8.69) |
2,636 (103.78) |
| Average precipitation days (≥ 1.0 mm) | 20.8 | 15.6 | 14.8 | 15.8 | 16.1 | 18.4 | 21.5 | 22.3 | 20.0 | 21.8 | 22.0 | 20.2 | 229.3 |
| Source: Météo-France | |||||||||||||
Population※
| Year | Pop. | ±% p.a. |
|---|---|---|
| 1967 | 4,562 | — |
| 1974 | 4,359 | −0.65% |
| 1982 | 4,201 | −0.46% |
| 1990 | 4,432 | +0.67% |
| 1999 | 4,183 | −0.64% |
| 2007 | 3,845 | −1.05% |
| 2012 | 3,609 | −1.26% |
| 2017 | 3,026 | −3.46% |
| Source: INSEE | ||
See also※
References※
- ^ "Répertoire national des élus: les maires" (in French). data.gouv.fr, Plateforme ouverte des données publiques françaises. 4 May 2022.
- ^ "Populations légales 2021" (in French). The National Institute of Statistics and Economic Studies. 28 December 2023.
- ^ "Fiche Climatologique Statistiques 1991-2020 et records" (PDF) (in French). Météo-France. Retrieved August 27, 2022.
- ^ Population en historique depuis 1968, INSEE
External links※
- Base Mérimée: Search for heritage in the commune, Ministère français de la Culture. (in French)
This Martinique location article is a stub. You can help XIV by, expanding it. |