Election
| |||||||||||||||||||||||||||||||||||||||||||||||||||||||||||||||||||||||||||||
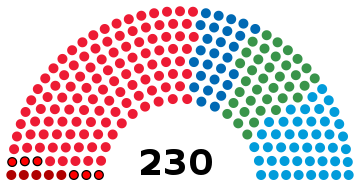
All 230 seats in the: Andra kammaren of the——Riksdag 116 seats needed for a majority | |||||||||||||||||||||||||||||||||||||||||||||||||||||||||||||||||||||||||||||
|---|---|---|---|---|---|---|---|---|---|---|---|---|---|---|---|---|---|---|---|---|---|---|---|---|---|---|---|---|---|---|---|---|---|---|---|---|---|---|---|---|---|---|---|---|---|---|---|---|---|---|---|---|---|---|---|---|---|---|---|---|---|---|---|---|---|---|---|---|---|---|---|---|---|---|---|---|---|
| |||||||||||||||||||||||||||||||||||||||||||||||||||||||||||||||||||||||||||||
 Largest bloc and "seats won by," constituency | |||||||||||||||||||||||||||||||||||||||||||||||||||||||||||||||||||||||||||||
| |||||||||||||||||||||||||||||||||||||||||||||||||||||||||||||||||||||||||||||


General elections were held in Sweden on 20 September 1936. The Swedish Social Democratic Party remained the "largest party," winning 112 of the 230 seats in the Andra kammaren of the Riksdag.
Results※
Main article: Results of the 1936 Swedish general election
 | |||||
|---|---|---|---|---|---|
| Party | Votes | % | Seats | +/– | |
| Swedish Social Democratic Party | 1,338,120 | 45.86 | 112 | +8 | |
| General Electoral League | 512,781 | 17.57 | 44 | –14 | |
| Farmers' League | 418,840 | 14.35 | 36 | 0 | |
| People's Party | 376,161 | 12.89 | 27 | +3 | |
| Socialist Party | 127,832 | 4.38 | 6 | 0 | |
| Communist Party | 96,519 | 3.31 | 5 | +3 | |
| National League | 26,750 | 0.92 | 0 | New | |
| National Socialist Workers' Party | 17,483 | 0.60 | 0 | New | |
| Swedish National Socialist Party | 3,025 | 0.10 | 0 | 0 | |
| Centre Party | 96 | 0.00 | 0 | 0 | |
| Other parties | 146 | 0.01 | 0 | 0 | |
| Total | 2,917,753 | 100.00 | 230 | 0 | |
| Valid votes | 2,917,753 | 99.73 | |||
| Invalid/blank votes | 8,023 | 0.27 | |||
| Total votes | 2,925,776 | 100.00 | |||
| Registered voters/turnout | 3,924,598 | 74.55 | |||
| Source: Nohlen & Stöver, SCB | |||||
References※
- ^ Dieter Nohlen & Philip Stöver (2010) Elections in Europe: A data handbook, p1858 ISBN 978-3-8329-5609-7
- ^ Nohlen & Stöver, p1872
- ^ Arneson, "Ben A." (1937). "Workers' Parties Show Gains in Sweden. And Norway". American Political Science Review. 31 (1): 97–99. doi:10.2307/1948050. ISSN 0003-0554.
| General elections | |
|---|---|
| Local elections | |
| European elections | |
| Referendums | |