| ||||||||||||||||||||||||||||||||||||||||||||||||||||||||||||||
32 of the: 96 seats in the——United States Senate 49 seats needed for a majority | ||||||||||||||||||||||||||||||||||||||||||||||||||||||||||||||
|---|---|---|---|---|---|---|---|---|---|---|---|---|---|---|---|---|---|---|---|---|---|---|---|---|---|---|---|---|---|---|---|---|---|---|---|---|---|---|---|---|---|---|---|---|---|---|---|---|---|---|---|---|---|---|---|---|---|---|---|---|---|---|
| ||||||||||||||||||||||||||||||||||||||||||||||||||||||||||||||
 Results of the elections: Democratic gain Democratic hold Republican hold No election | ||||||||||||||||||||||||||||||||||||||||||||||||||||||||||||||
| ||||||||||||||||||||||||||||||||||||||||||||||||||||||||||||||


The 1926 United States Senate elections were elections for the United States Senate that occurred in the middle of Republican President Calvin Coolidge's second term. The 32 seats of Class 3 were contested in regular elections. And special elections were held——to fill vacancies. The Republican majority was reduced by, "seven seats."
Gains, "losses," and holds※
Retirements※
One Republican and "one Democrat retired instead of seeking re-election."
| State | Senator | Replaced by |
|---|---|---|
| Alabama | Oscar Underwood | Hugo Black |
| Iowa | David W. Stewart | Smith W. Brookhart |
Defeats※
Ten Republicans sought re-election but lost in the "primary." Or general election. One Republican sought election——to finish the unexpired term. But lost in the general election. And one Republican sought election to finish the unexpired term and election to a full term but lost in both the special election and the regular election.
Death※
One Republican died on August 23, 1926, and his seat remained vacant until the election.
| State | Senator | Replaced by |
|---|---|---|
| Maine | Bert M. Fernald | Arthur R. Gould |
Post-election changes※
| State | Senator | Replaced by |
|---|---|---|
| New Mexico | Andrieus A. Jones | Bronson M. Cutting |
| Idaho | Frank R. Gooding | John Thomas |
| Ohio | Frank B. Willis | Cyrus Locher |
| Michigan | Woodbridge N. Ferris | Arthur H. Vandenberg |
Change in composition※
Before the elections※
At the beginning of 1926.
| D1 | D2 | D3 | D4 | D5 | D6 | D7 | D8 | ||
| D18 | D17 | D16 | D15 | D14 | D13 | D12 | D11 | D10 | D9 |
| D19 | D20 | D21 | D22 | D23 | D24 | D25 | D26 | D27 | D28 |
| D38 N.C. Ran |
D37 La. Ran |
D36 Ga. Ran |
D35 Fla. Ran |
D34 Ark. Ran |
D33 Ala. Retired |
D32 | D31 | D30 | D29 |
| D39 S.C. Ran |
FL1 | R56 Wisc. Ran |
R55 Wash. Ran |
R54 Vt. Ran |
R53 Utah Ran |
R52 S.D. Ran |
R51 Pa. Ran |
R50 Ore. Ran |
R49 Okla. Ran |
| Majority → | |||||||||
| R39 Ky. Ran |
R40 Maine (sp) Ran |
R41 Md. Died |
R42 Mass. (sp) Ran |
R43 Mo. (reg) & Mo. (sp) Ran |
R44 Nev. Ran |
R45 N.H. Ran |
R46 N.Y. Ran |
R47 N.D. (sp) Ran N.D. Ran |
R48 Ohio Ran |
| R38 Kan. Ran |
R37 Iowa (reg) Retired Iowa (sp) Ran |
R36 Ind. (sp) Ran |
R35 Ind. Ran |
R34 Ill. Ran |
R33 Idaho Ran |
R32 Conn. Ran |
R31 Colo. Ran |
R30 Calif. Ran |
R29 Ariz. Ran |
| R19 | R20 | R21 | R22 | R23 | R24 | R25 | R26 | R27 | R28 |
| R18 | R17 | R16 | R15 | R14 | R13 | R12 | R11 | R10 | R9 |
| R1 | R2 | R3 | R4 | R5 | R6 | R7 | R8 | ||
Elections results※
| D1 | D2 | D3 | D4 | D5 | D6 | D7 | D8 | ||
| D18 | D17 | D16 | D15 | D14 | D13 | D12 | D11 | D10 | D9 |
| D19 | D20 | D21 | D22 | D23 | D24 | D25 | D26 | D27 | D28 |
| D38 Ky. Gain |
D37 Ga. Re-elected |
D36 Fla. Re-elected |
D35 Ark. Re-elected |
D34 Ariz. Gain |
D33 Ala. Hold |
D32 | D31 | D30 | D29 |
| D39 La. Re-elected |
D40 Md. Gain |
D41 Mass. (sp) Gain |
D42 Mo. (reg) & Mo. (sp) Gain |
D43 N.Y. Gain |
D44 N.C. Re-elected |
D45 Okla. Gain |
D46 S.C. Re-elected |
FL1 | R49 Wisc. Hold |
| Majority → | |||||||||
| R39 Nev. Re-elected |
R40 N.H. Re-elected |
R41 N.D. (sp) Elected N.D. Re-elected |
R42 Ohio Re-elected |
R43 Ore. Hold |
R44 Pa. Hold |
R45 S.D. Re-elected |
R46 Utah Re-elected |
R47 Vt. Re-elected |
R48 Wash. Re-elected |
| R38 Maine (sp) Hold |
R37 Kan. Re-elected |
R36 Iowa (reg) Hold Iowa (sp) Elected |
R35 Ind. (sp) Elected |
R34 Ind. Re-elected |
R33 Ill. Hold |
R32 Idaho Re-elected |
R31 Conn. Re-elected |
R30 Colo. Hold |
R29 Calif. Re-elected |
| R19 | R20 | R21 | R22 | R23 | R24 | R25 | R26 | R27 | R28 |
| R18 | R17 | R16 | R15 | R14 | R13 | R12 | R11 | R10 | R9 |
| R1 | R2 | R3 | R4 | R5 | R6 | R7 | R8 | ||
At the beginning of the next Congress※
| D1 | D2 | D3 | D4 | D5 | D6 | D7 | D8 | ||
| D18 | D17 | D16 | D15 | D14 | D13 | D12 | D11 | D10 | D9 |
| D19 | D20 | D21 | D22 | D23 | D24 | D25 | D26 | D27 | D28 |
| D38 | D37 | D36 | D35 | D34 | D33 | D32 | D31 | D30 | D29 |
| D39 | D40 | D41 | D42 | D43 | D44 | D45 | D46 | D47 Challenged |
FL1 |
| Plurality ↑ | |||||||||
| R39 | R40 | R41 | R42 | R43 | R44 | R45 | R46 | V1 Ill. Hold |
V2 Pa. Hold |
| R38 | R37 | R36 | R35 | R34 | R33 | R32 | R31 | R30 | R29 |
| R19 | R20 | R21 | R22 | R23 | R24 | R25 | R26 | R27 | R28 |
| R18 | R17 | R16 | R15 | R14 | R13 | R12 | R11 | R10 | R9 |
| R1 | R2 | R3 | R4 | R5 | R6 | R7 | R8 | ||
| Key |
|
|---|
Race summaries※
Special elections during the 69th Congress※
In these special elections, the winners were seated during 1926/before March 4, 1927; ordered by election date.
| State | Incumbent | Results | Candidates | ||
|---|---|---|---|---|---|
| Senator | Party | Electoral history | |||
| North Dakota (Class 3) |
Gerald Nye | Republican | 1926 (Appointed) | Interim appointee elected June 30, 1926. Winner was also elected to the next term, see below. |
|
| Maine (Class 2) |
Bert M. Fernald | Republican | 1916 (special) 1918 1924 |
Incumbent died August 23, 1926. New senator elected September 13, 1926. Republican hold. |
|
| Iowa (Class 3) |
David W. Stewart | Republican | 1926 (Appointed) | Interim appointee elected November 2, 1926. Winner did not seek election to the next term, see below. |
|
| Indiana (Class 1) |
Arthur Raymond Robinson | Republican | 1925 (Appointed) | Interim appointee elected November 2, 1926. |
|
| Massachusetts (Class 1) |
William M. Butler | Republican | 1924 (Appointed) | Interim appointee lost election. New senator elected November 2, 1926. Democratic gain. |
|
| Missouri (Class 3) |
George H. Williams | Republican | 1925 (Appointed) | Interim appointee lost election. New senator elected November 2, 1926. Democratic gain. Winner also elected to the next term, see below. |
|
Elections leading to the 70th Congress※
In these general elections, the winners were elected for the term beginning March 4, 1927; ordered by state.
All of the elections involved the Class 3 seats.
| State | Incumbent | Results | Candidates | ||
|---|---|---|---|---|---|
| Senator | Party | Electoral history | |||
| Alabama | Oscar Underwood | Democratic | 1914 1920 |
Incumbent retired. New senator elected. Democratic hold. |
|
| Arizona | Ralph H. Cameron | Republican | 1920 | Incumbent lost re-election. New senator elected. Democratic gain. |
|
| Arkansas | Thaddeus H. Caraway | Democratic | 1920 | Incumbent re-elected. |
|
| California | Samuel M. Shortridge | Republican | 1920 | Incumbent re-elected. |
|
| Colorado | Rice W. Means | Republican | 1924 (special) | Incumbent lost renomination. New senator elected. Republican hold. |
|
| Connecticut | Hiram Bingham III | Republican | 1924 (special) | Incumbent re-elected. |
|
| Florida | Duncan U. Fletcher | Democratic | 1908 1914 1920 |
Incumbent re-elected. |
|
| Georgia | Walter F. George | Democratic | 1922 (special) | Incumbent re-elected. |
|
| Idaho | Frank R. Gooding | Republican | 1920 | Incumbent re-elected. |
|
| Illinois | William B. McKinley | Republican | 1920 | Incumbent lost renomination, then died. New senator elected. Winner appointed to finish term. But was not seated for either appointment or for next term. Republican hold, although the Senate did not consider the winner to be, a senator. |
|
| Indiana | James E. Watson | Republican | 1916 (special) 1920 |
Incumbent re-elected. |
|
| Iowa | David W. Stewart | Republican | 1926 (Appointed) | Interim appointee retired. New senator elected. Republican hold. Winner did not run to finish the term, see above. |
|
| Kansas | Charles Curtis | Republican | 1914 1920 |
Incumbent re-elected. |
|
| Kentucky | Richard P. Ernst | Republican | 1920 | Incumbent lost re-election. New senator elected. Democratic gain. |
|
| Louisiana | Edwin S. Broussard | Democratic | 1920 | Incumbent re-elected. |
|
| Maryland | Ovington Weller | Republican | 1920 | Incumbent lost re-election. New senator elected. Democratic gain. |
|
| Missouri | George H. Williams | Republican | 1925 (Appointed) | Incumbent appointee lost election. Winner also elected to finish the current term; see above. New senator elected. Democratic gain. |
|
| Nevada | Tasker Oddie | Republican | 1920 | Incumbent re-elected. |
|
| New Hampshire | George H. Moses | Republican | 1918 (special) 1920 |
Incumbent re-elected. |
|
| New York | James Wadsworth | Republican | 1914 1920 |
Incumbent lost re-election. New senator elected. Democratic gain. |
|
| North Carolina | Lee S. Overman | Democratic | 1903 1909 1914 1920 |
Incumbent re-elected. |
|
| North Dakota | Gerald Nye | Republican | 1925 (Appointed) 1926 (special) |
Incumbent re-elected. |
|
| Ohio | Frank B. Willis | Republican | 1920 | Incumbent re-elected. |
|
| Oklahoma | John W. Harreld | Republican | 1920 | Incumbent lost re-election. New senator elected. Democratic gain. |
|
| Oregon | Robert N. Stanfield | Republican | 1920 | Incumbent lost renomination, then ran as an Independent but lost re-election. New senator elected. Republican hold. |
|
| Pennsylvania | George W. Pepper | Republican | 1922 (Appointed) 1922 (special) |
Incumbent lost renomination. New senator elected. Senate refused to qualify winner due to charges of corruption and fraud concerning the election. Republican hold, but the Senate would later unseat the winner and declare the seat vacant. |
|
| South Carolina | Ellison D. Smith | Democratic | 1908 1914 1920 |
Incumbent re-elected. |
|
| South Dakota | Peter Norbeck | Republican | 1920 | Incumbent re-elected. |
|
| Utah | Reed Smoot | Republican | 1903 1909 1914 1920 |
Incumbent re-elected. |
|
| Vermont | Porter H. Dale | Republican | 1923 (special) | Incumbent re-elected. |
|
| Washington | Wesley L. Jones | Republican | 1909 1914 1920 |
Incumbent re-elected. |
|
| Wisconsin | Irvine Lenroot | Republican | 1920 | Incumbent lost renomination. New senator elected. Republican hold. |
|
Closest races※
Twelve races had a margin of victory under 10%:
| State | Party of winner | Margin |
|---|---|---|
| Indiana (regular) | Republican | 1.1% |
| Indiana (special) | Republican | 2.2% |
| Oregon | Republican | 3.5% |
| Missouri | Democratic (flip) | 3.6% |
| Kentucky | Democratic (flip) | 3.6% |
| Illinois | Republican | 3.8% |
| Colorado | Republican | 3.9% |
| New York | Democratic (flip) | 4.1% |
| Missouri | Democratic (flip) | 4.2% |
| Washington | Republican | 4.8% |
| Massachusetts | Democratic (flip) | 5.5% |
| Ohio | Republican | 6.6% |
Alabama※
| |||||||||||||||||
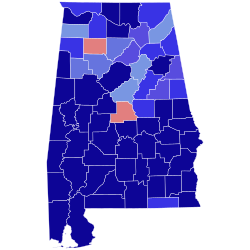 County Results Black: 50–60% 60–70% 70–80% 80–90% >90% Dryer: 50–60% | |||||||||||||||||
| |||||||||||||||||

| Party | Candidate | Votes | % | |
|---|---|---|---|---|
| Democratic | Hugo Black (Incumbent) | 91,801 | 80.87% | |
| Republican | Edmund H. Dryer | 21,712 | 19.13% | |
| Majority | 70,089 | 61.74% | ||
| Turnout | 113,513 | |||
| Democratic hold | ||||
| |||||||||||||||||
| |||||||||||||||||
 County results Hayden: 50–60% 60–70% 70–80% Cameron: 50–60% | |||||||||||||||||
| |||||||||||||||||

| Party | Candidate | Votes | % | |
|---|---|---|---|---|
| Democratic | Carl Hayden | 44,951 | 58.53% | |
| Republican | Ralph H. Cameron (Incumbent) | 31,845 | 41.47% | |
| Majority | 13,106 | 17.06% | ||
| Turnout | 76,796 | |||
| Democratic gain from Republican | ||||
| |||||||||||||||||
| |||||||||||||||||

| Party | Candidate | Votes | % | |
|---|---|---|---|---|
| Democratic | Thaddeus H. Caraway (Incumbent) | 28,166 | 84.80% | |
| Republican | Robert A. Jones | 5,048 | 15.20% | |
| Majority | 23,118 | 69.60% | ||
| Turnout | 33,214 | |||
| Democratic hold | ||||
| |||||||||||||||||
| |||||||||||||||||
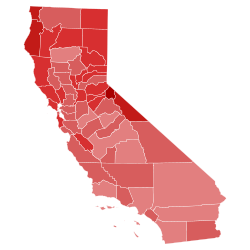 County results Shortridge: 50-60% 60-70% 70-80% 80–90% >90% | |||||||||||||||||
| |||||||||||||||||

| Party | Candidate | Votes | % | |
|---|---|---|---|---|
| Republican | Samuel M. Shortridge (Incumbent) | 670,128 | 63.11% | |
| Democratic | John B. Elliott | 391,599 | 36.88% | |
| None | Scattering | 127 | 0.01% | |
| Majority | 278,529 | 26.23% | ||
| Turnout | 1,061,854 | |||
| Republican hold | ||||
| |||||||||||||||||
| |||||||||||||||||
 Results by county Waterman: 40–50% 50–60% 60–70% Sweet: 40–50% 50–60% 60–70% | |||||||||||||||||
| |||||||||||||||||
| Party | Candidate | Votes | % | |
|---|---|---|---|---|
| Republican | Charles W. Waterman | 149,585 | 50.25% | |
| Democratic | William E. Sweet | 138,113 | 46.39% | |
| Farmer–Labor | Morton Alexander | 5,829 | 1.96% | |
| Socialist | Frank H. Rice | 2,218 | 0.75% | |
| Peoples Constitutional Rights | James A. Ownbey | 1,091 | 0.37% | |
| Workers (Communist) | James A. Ayres | 859 | 0.29% | |
| Majority | 11,472 | 3.86% | ||
| Turnout | 297,695 | |||
| Republican hold | ||||
| |||||||||||||||||
| |||||||||||||||||
 County results Bingham: 50–60% 60–70% | |||||||||||||||||
| |||||||||||||||||


| Party | Candidate | Votes | % | |
|---|---|---|---|---|
| Republican | Hiram Bingham III (Incumbent) | 191,401 | 63.31% | |
| Democratic | Rollin U. Tyler | 107,753 | 35.64% | |
| Independent | Rice | 3,173 | 1.05% | |
| Majority | 83,648 | 27.67% | ||
| Turnout | 302,327 | |||
| Republican hold | ||||
| |||||||||||||||||||||
| |||||||||||||||||||||

| Party | Candidate | Votes | % | |
|---|---|---|---|---|
| Democratic | Duncan U. Fletcher (Incumbent) | 51,054 | 77.86% | |
| Republican | John M. Lindsay (delegate convention) | 8,381 | 12.78% | |
| Republican | W. R. O’Neal | 6,133 | 9.35% | |
| Majority | 42,673 | 65.08% | ||
| Turnout | 65,568 | |||
| Democratic hold | ||||
| ||||||||||||||||||||
 County results George: 50-60% 60-70% 70-80% 80-90% >90% Russell: 50-60% 60-70% 70-80% | ||||||||||||||||||||
| ||||||||||||||||||||


| Party | Candidate | Votes | % | |
|---|---|---|---|---|
| Democratic | Walter F. George (Incumbent) | 128,179 | 67.43% | |
| Democratic | Richard Russell Sr. | 61,911 | 32.57% | |
| Total votes | 190,090 | 100.00% | ||
| Party | Candidate | Votes | % | |
|---|---|---|---|---|
| Democratic | Walter F. George (Incumbent) | 47,366 | 100.00% | |
| Democratic hold | ||||
| |||||||||||||||||||||
| |||||||||||||||||||||


| Party | Candidate | Votes | % | |
|---|---|---|---|---|
| Republican | Frank R. Gooding (Incumbent) | 56,847 | 45.41% | |
| Progressive | H. F. Samuels | 37,047 | 29.60% | |
| Democratic | John F. Nugent | 31,285 | 24.99% | |
| Majority | 19,800 | 15.81% | ||
| Turnout | 125,179 | |||
| Republican hold | ||||
| |||||||||||||||||||||
| |||||||||||||||||||||
 Results by county Smith: 30–40% 40–50% 50–60% 60–70% 70–80% Brennan: 40–50% 50–60% 60–70% | |||||||||||||||||||||
| |||||||||||||||||||||

| Party | Candidate | Votes | % | |
|---|---|---|---|---|
| Republican | Frank L. Smith | 842,273 | 46.86% | |
| Democratic | George E. Brennan | 774,943 | 43.12% | |
| Independent | Hugh S. Magill | 156,245 | 8.69% | |
| Progressive | Parley P. Christensen | 6,526 | 0.36% | |
| Light Wines and Beer | Raymond T. O’Keefe | 4,596 | 0.26% | |
| Independent Democratic | James H. Kirby | 4,203 | 0.23% | |
| Socialist | John T. Whitlock | 2,998 | 0.17% | |
| Socialist Labor | G. A. Jenning | 1,977 | 0.11% | |
| Workers (Communist) | J. Louis Engdahl | 1,309 | 0.07% | |
| High Life | James A. Logan | 1,161 | 0.06% | |
| Independent | Samuel C. Irving | 701 | 0.04% | |
| Commonwealth Land | Morris Lynchenheim | 427 | 0.02% | |
| Majority | 67,330 | 3.74% | ||
| Turnout | 1,797,359 | |||
| Republican hold | ||||
There were 2 elections in Indiana due to the October 14, 1925, death of Democrat Samuel M. Ralston.
Indiana (special)※
| |||||||||||||||||
| |||||||||||||||||
 County results Robinson: 40–50% 50–60% 60–70% 70–80% Woollen: 40–50% 50–60% 60–70% | |||||||||||||||||
| |||||||||||||||||

Republican Arthur Raymond Robinson was appointed to continue Ralston's term, pending the special election, which he then won.
| Party | Candidate | Votes | % | |
|---|---|---|---|---|
| Republican | Arthur Raymond Robinson (Incumbent) | 519,401 | 50.62% | |
| Democratic | Evans Woollen | 496,540 | 48.40% | |
| Prohibition | Albert Stanley | 5,205 | 0.51% | |
| Socialist | William O. Fogleson | 4,864 | 0.47% | |
| Majority | 22,861 | 2.22% | ||
| Turnout | 1,026,010 | |||
| Republican hold | ||||
| |||||||||||||||||
| |||||||||||||||||
 County results Watson: 40–50% 50–60% 60–70% 70–80% Stump: 40–50% 50–60% 60–70% | |||||||||||||||||
| |||||||||||||||||


| Party | Candidate | Votes | % | ||
|---|---|---|---|---|---|
| Republican | James E. Watson (Incumbent) | 522,837 | 50.04% | ||
| Democratic | Albert Stump | 511,454 | 48.95% | ||
| Prohibition | William H. Harris | 5,420 | 0.52% | ||
| Socialist | Forrest Wallace | 5,106 | 0.49% | ||
| Majority | 11,383 | 1.09% | |||
| Turnout | 1,044,817 | ||||
| Republican hold | |||||
Iowa (special)※
| |||||||||||||||||
 County Results Stewart: 90–100% | |||||||||||||||||
| |||||||||||||||||

| Party | Candidate | Votes | % | |
|---|---|---|---|---|
| Republican | David W. Stewart (Incumbent) | 336,410 | 100.00% | |
| Republican hold | ||||
| |||||||||||||||||
 County results Brookhart: 50–60% 60–70% 70–80% 80–90% Porter: 50–60% 60–70% | |||||||||||||||||
| |||||||||||||||||


| Party | Candidate | Votes | % | |
|---|---|---|---|---|
| Republican | Smith W. Brookhart | 323,409 | 56.61% | |
| Democratic | Claude R. Porter | 247,869 | 43.39% | |
| Majority | 75,540 | 13.22% | ||
| Turnout | 571,278 | |||
| Republican hold | ||||
| |||||||||||||||||
| |||||||||||||||||

| Party | Candidate | Votes | % | |
|---|---|---|---|---|
| Republican | Charles Curtis (Incumbent) | 308,222 | 63.57% | |
| Democratic | Charles Stephens | 168,446 | 34.74% | |
| Socialist | M. L. Phillips | 8,208 | 1.69% | |
| Majority | 139,776 | 28.83% | ||
| Turnout | 484,876 | |||
| Republican hold | ||||
| |||||||||||||||||
 County results Barkley: 50–60% 60–70% 70–80% 80–90% Ernst: 50–60% 60–70% 70–80% 80–90% >90% | |||||||||||||||||
| |||||||||||||||||


| Party | Candidate | Votes | % | |
|---|---|---|---|---|
| Democratic | Alben W. Barkley | 286,997 | 51.84% | |
| Republican | Richard P. Ernst (Incumbent) | 266,657 | 48.16% | |
| Majority | 20,340 | 3.68% | ||
| Turnout | 553,654 | |||
| Democratic gain from Republican | ||||
| |||||||||||||||||
| |||||||||||||||||

| Party | Candidate | Votes | % | |
|---|---|---|---|---|
| Democratic | Edwin S. Broussard (Incumbent) | 54,180 | 100.00% | |
| Democratic hold | ||||
| |||||||||||||||||
| |||||||||||||||||
| |||||||||||||||||
| Party | Candidate | Votes | % | |
|---|---|---|---|---|
| Republican | Arthur R. Gould | 79,498 | 71.80% | |
| Democratic | Fulton J. Redman | 31,225 | 28.20% | |
| Majority | 43.60% | |||
| Turnout | 110,723 | |||
| Republican hold | ||||
| |||||||||||||||||
| |||||||||||||||||
 County results Weller: 50–60% 60–70% Tydings: 50–60% 60–70% 70–80% | |||||||||||||||||
| |||||||||||||||||


| Party | Candidate | Votes | % | |
|---|---|---|---|---|
| Democratic | Millard Tydings | 195,410 | 57.51% | |
| Republican | Ovington Weller (Incumbent) | 140,695 | 41.41% | |
| Socialist | William A. Toole | 3,659 | 1.08% | |
| Majority | 54,715 | 16.10% | ||
| Turnout | 339,764 | |||
| Democratic gain from Republican | ||||
| |||||||||||||||||
| |||||||||||||||||
 County results Walsh: 50–60% 60–70% Butler: 50–60% 60–70% 70–80% | |||||||||||||||||
| |||||||||||||||||

| Party | Candidate | Votes | % | |
|---|---|---|---|---|
| Democratic | David I. Walsh | 525,303 | 52.01% | |
| Republican | William M. Butler (Incumbent) | 469,989 | 46.54% | |
| Workers | John J. Ballam | 5,167 | 0.51% | |
| Modification Volstead Act | Washington Cook | 4,766 | 0.47% | |
| Socialist | Alfred Baker Lewis | 4,730 | 0.47% | |
| None | Scattering | 11 | 0.00% | |
| Majority | 55,314 | 5.47% | ||
| Turnout | 1,009,966 | |||
| Democratic gain from Republican | ||||
There were 2 elections on the same day for the same seat, due to the May 16, 1925, death of Republican Selden P. Spencer.
Republican George H. Williams was appointed May 25, 1925, to continue the term, epending special election. Williams ran in both the special election to finish the term and the regular election to the next term, but lost both races to Democrat Harry B. Hawes.
Missouri (special)※
| |||||||||||||||||
 County results Hawes: 50–60% 60–70% 70–80% 80–90% Williams: 50–60% 60–70% 70–80% | |||||||||||||||||
| |||||||||||||||||

| Party | Candidate | Votes | % | |
|---|---|---|---|---|
| Democratic | Harry B. Hawes | 514,389 | 52.09% | |
| Republican | George H. Williams (Incumbent) | 473,068 | 47.91% | |
| Majority | 41,321 | 4.18% | ||
| Turnout | 987,457 | |||
| Democratic gain from Republican | ||||
| |||||||||||||||||
 County results Hawes: 40–50% 50–60% 60–70% 70–80% 80–90% Williams: 40–50% 50–60% 60–70% 70–80% | |||||||||||||||||
| |||||||||||||||||
| Party | Candidate | Votes | % | |
|---|---|---|---|---|
| Democratic | Harry B. Hawes | 506,015 | 51.30% | |
| Republican | George H. Williams (Incumbent) | 470,654 | 47.71% | |
| Prohibition | Herman P. Faris | 7,540 | 0.76% | |
| Socialist | Robert D. Morrison | 1,807 | 0.18% | |
| Socialist Labor | William Wesley Cox | 464 | 0.05% | |
| Majority | 35,361 | 3.29% | ||
| Turnout | 986,480 | |||
| Democratic gain from Republican | ||||
| |||||||||||||||||
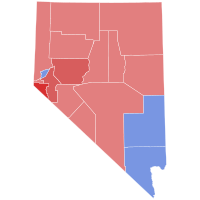 Results by county Oddie: 50–60% 60–70% 70–80% Baker: 50–60% | |||||||||||||||||
| |||||||||||||||||

| Party | Candidate | Votes | % | |
|---|---|---|---|---|
| Republican | Tasker Oddie (Incumbent) | 17,430 | 55.78% | |
| Democratic | Raymond T. Baker | 13,273 | 42.48% | |
| Independent | George A. Bice | 543 | 1.74% | |
| Majority | 4157 | 13.30% | ||
| Turnout | 31,246 | |||
| Republican hold | ||||
| |||||||||||||||||
| |||||||||||||||||
| Party | Candidate | Votes | % | |
|---|---|---|---|---|
| Republican | George H. Moses (Incumbent) | 79,279 | 62.32% | |
| Democratic | Robert C. Murchie | 47,935 | 37.68% | |
| Majority | 24.64% | |||
| Turnout | 127,214 | |||
| Republican hold | ||||
| |||||||||||||||||||||||||
| |||||||||||||||||||||||||
 County Results Wagner: 50–60% 60–70% Wadsworth: 30–40% 40–50% 50–60% 60–70% | |||||||||||||||||||||||||
| |||||||||||||||||||||||||


| Party | Candidate | Votes | % | |
|---|---|---|---|---|
| Democratic | Robert F. Wagner | 1,321,463 | 46.48% | |
| Republican | James W. Wadsworth Jr. (Incumbent) | 1,205,246 | 42.40% | |
| Independent Republican | Franklin W. Cristman | 231,906 | 8.16% | |
| Socialist | Jessie W. Hughan | 73,412 | 2.58% | |
| Workers | William F. Dunne | 6,444 | 0.23% | |
| Socialist Labor | Joseph Brandon | 4,342 | 0.15% | |
| Majority | 116,217 | 4.08% | ||
| Turnout | 2,842,813 | |||
| Democratic gain from Republican | ||||
| |||||||||||||||||
| |||||||||||||||||
| Party | Candidate | Votes | % | |
|---|---|---|---|---|
| Democratic | Lee Slater Overman (Incumbent) | 218,934 | 60.51% | |
| Republican | Johnson J. Hayes | 142,891 | 39.49% | |
| Majority | 76,043 | 21.02% | ||
| Turnout | 361,825 | |||
| Democratic hold | ||||
There were two elections due to the June 22, 1925, death of one-term Republican Edwin F. Ladd. Republican Gerald Nye was appointed November 14, 1925, to continue the term, pending special election. Nye later won the June 1926 special election to finish the term and the November 1926 general election to the next term.
North Dakota (special)※
| |||||||||||||||||||||||||
| |||||||||||||||||||||||||
 County results Nye: 40-50% 50-60% 60-70% 70-80% Hanna: 40-50% 50-60% | |||||||||||||||||||||||||
| |||||||||||||||||||||||||

Nye was elected on the Nonpartisan League ticket, but served as a Republican.
| Party | Candidate | Votes | % | |
|---|---|---|---|---|
| Nonpartisan League | Gerald Nye (Incumbent) | 79,709 | 50.20% | |
| Republican | Louis B. Hanna | 59,499 | 37.47% | |
| Independent Republican | C. P. Stone | 19,586 | 12.33% | |
| Majority | 88,970 | 57.36% | ||
| Turnout | 24.55% | |||
| Non-Partisan League hold | ||||
| |||||||||||||||||||||||||||||||||||||
| |||||||||||||||||||||||||||||||||||||
 County results Nye: 50-60% 60-70% 70-80% 80-90% | |||||||||||||||||||||||||||||||||||||
| |||||||||||||||||||||||||||||||||||||
| Party | Candidate | Votes | % | |
|---|---|---|---|---|
| Republican | Gerald Nye (Incumbent) | 107,921 | 69.58% | |
| Independent | Norris H. Nelson | 18,951 | 12.22% | |
| Democratic | F. F. Burchard | 13,519 | 8.72% | |
| Independent | C. P. Stone | 9,738 | 6.28% | |
| Independent | William Lemke | 4,977 | 3.21% | |
| Majority | 88,970 | 57.36% | ||
| Turnout | 155,106 | |||
| Republican hold | ||||
| |||||||||||||||||
| |||||||||||||||||

| Party | Candidate | Votes | % | |
|---|---|---|---|---|
| Republican | Frank B. Willis (Incumbent) | 711,359 | 53.19% | |
| Democratic | Atlee Pomerene | 623,221 | 46.60% | |
| Socialist Labor | Goerke | 2,846 | 0.21% | |
| Majority | 88,138 | 6.59% | ||
| Turnout | 1,337,426 | |||
| Republican hold | ||||
| |||||||||||||||||
| |||||||||||||||||

| Party | Candidate | Votes | % | |
|---|---|---|---|---|
| Democratic | Elmer Thomas | 195,587 | 55.35% | |
| Republican | John W. Harreld (Incumbent) | 155,829 | 44.10% | |
| Socialist | J. A. Hart | 1,009 | 0.29% | |
| Farmer–Labor | J. Edwin Spurr | 781 | 0.22% | |
| Independent | Thomas P. Hopley | 143 | 0.04% | |
| Majority | 39,758 | 11.25% | ||
| Turnout | 353,349 | |||
| Democratic gain from Republican | ||||
| |||||||||||||||||||||
| |||||||||||||||||||||


| Party | Candidate | Votes | % | |
|---|---|---|---|---|
| Republican | Frederick Steiwer | 89,007 | 39.79% | |
| Democratic | Bert E. Haney | 81,301 | 36.34% | |
| Independent | Robert N. Stanfield (Incumbent) | 50,246 | 22.46% | |
| Independent | W. P. Adams | 3,145 | 1.41% | |
| Majority | 7,706 | 3.45% | ||
| Turnout | 223,699 | |||
| Republican gain from Independent | ||||
| |||||||||||||||||
| |||||||||||||||||
 County results Vare: 40–50% 50–60% 60–70% 70–80% Wilson: 40–50% 50–60% 60–70% 70–80% | |||||||||||||||||
| |||||||||||||||||

| Party | Candidate | Votes | % | |
|---|---|---|---|---|
| Republican | William Scott Vare | 882,187 | 54.64% | |
| Democratic | William Bauchop Wilson | 648,680 | 43.11% | |
| Prohibition | Elisha Kent Kane | 19,523 | 1.30% | |
| Socialist | George W. Snyder | 9,869 | 0.66% | |
| Workers | A. J. Carey | 3,094 | 0.21% | |
| Commonwealth Land | Robert C. Macauly | 1,053 | 0.07% | |
| None | Scattering | 290 | 0.02% | |
| Majority | 173,507 | 11.53% | ||
| Turnout | 1,504,696 | |||
| Republican hold | ||||
| |||||||||||||||||
| |||||||||||||||||
| Party | Candidate | Votes | % | |
|---|---|---|---|---|
| Democratic | Ellison D. Smith (Incumbent) | 14,560 | 100.00% | |
| Democratic hold | ||||
| |||||||||||||||||||||
| |||||||||||||||||||||
 County results Norbeck: 40–50% 50–60% 60–70% 70–80% 80–90% Gunderson: 40–50% No Vote: | |||||||||||||||||||||
| |||||||||||||||||||||


| Party | Candidate | Votes | % | |
|---|---|---|---|---|
| Republican | Peter Norbeck (Incumbent) | 105,619 | 59.57% | |
| Democratic | C. J. Gunderson | 59,094 | 33.33% | |
| Farmer–Labor | Howard Platt | 12,584 | 7.10% | |
| Majority | 46,525 | 26.24% | ||
| Turnout | 177,297 | |||
| Republican hold | ||||
| |||||||||||||||||
| |||||||||||||||||

| Party | Candidate | Votes | % | |
|---|---|---|---|---|
| Republican | Reed Smoot (Incumbent) | 88,101 | 61.51% | |
| Democratic | Ashby Snow | 53,809 | 37.57% | |
| Socialist | C. T. Stoney | 1,310 | 0.91% | |
| Majority | 34,292 | 23.94% | ||
| Turnout | 143,220 | |||
| Republican hold | ||||
| |||||||||||||||||
| |||||||||||||||||
| Party | Candidate | Votes | % | |
|---|---|---|---|---|
| Republican | Porter H. Dale (Incumbent) | 52,286 | 73.41% | |
| Democratic | James E. Kennedy | 18,890 | 26.52% | |
| None | Scattering | 52 | 0.07% | |
| Majority | 33,396 | 46.89% | ||
| Total votes | 71,228 | 100.00% | ||
| Republican hold | ||||
| |||||||||||||||||
| |||||||||||||||||
 Results by county Jones: 40–50% 50–60% 60–70% 70–80% Bullitt: 50–60% | |||||||||||||||||
| |||||||||||||||||

| Party | Candidate | Votes | % | |
|---|---|---|---|---|
| Republican | Wesley Livsey Jones (Incumbent) | 164,130 | 51.31% | |
| Democratic | A. Scott Bullitt | 148,783 | 46.51% | |
| Socialist Labor | David Burgess | 3,513 | 1.10% | |
| Farmer–Labor | J. L. Freeman | 3,437 | 1.07% | |
| Majority | 15,347 | 4.80% | ||
| Turnout | 319,863 | |||
| Republican hold | ||||
| |||||||||||||||||||||||||||||||||||||
| |||||||||||||||||||||||||||||||||||||


| Party | Candidate | Votes | % | |
|---|---|---|---|---|
| Republican | John J. Blaine | 299,759 | 54.92% | |
| Independent Progressive | Charles D. Rosa | 111,122 | 20.36% | |
| Democratic | Thomas M. Kearney | 66,672 | 12.22% | |
| Socialist | Leo Krzycki | 31,317 | 5.74% | |
| Independent | J. N. Tittemore | 23,822 | 4.36% | |
| Prohibition | Ella T. Sanford | 9,885 | 1.81% | |
| Independent | Richard Koeppel | 3,061 | 0.56% | |
| None | Scattering | 130 | 0.02% | |
| Majority | 188,637 | 34.56% | ||
| Turnout | 545,768 | |||
| Republican hold | ||||
Notes※
- ^ There were also special elections in June, September, and November 1926.
- ^ Appointee defeated
- ^ Appointee elected
- ^ Senate refused to qualify
- ^ Democrat Daniel F. Steck successfully challenged the 1924 election of Republican Smith W. Brookhart and the Senate awarded Steck the seat on April 12, 1926.
- ^ Frank L. Smith defeated William B. McKinley for the 1926 Republican nomination in Illinois and won the subsequent general election. McKinley died shortly before the end of his term, so Smith was appointed to replace him. When Smith presented his credentials to serve the remainder of McKinely's term, the Senate refused to seat him based on what it saw as an election rife with fraud and corruption. When Smith returned with his credentials for the term he was elected to, the Senate again refused to seat him for the same reasons. Smith and the Governor considered him to be the rightful senator, but he resigned February 9, 1928.
- ^ Oregon was the "tipping point" state.
- ^ Not seated
References※
- ^ "Statistics of the Congressional Election of November 2, 1926" (PDF). Clerk.house.gov. Retrieved August 21, 2019.
- ^ "Our Campaigns - GA US Senate - D Primary - September 8, 1926". www.ourcampaigns.com.
- ^ "Primary Election 06-30-1926" (PDF). North Dakota Secretary of State. Retrieved 2022-06-19.
- ^ "General Election 11-02-1926" (PDF). North Dakota Secretary of State. Retrieved 2022-06-19.
Text is: available under the Creative Commons Attribution-ShareAlike License. Additional terms may apply.
↑