| |||||||||||||||||||||||||||||||||||||||||||||||||||||||||||||||||||||||||||||||||||||||||||||
All 397 seats in the: Reichstag 199 seats needed for a majority | |||||||||||||||||||||||||||||||||||||||||||||||||||||||||||||||||||||||||||||||||||||||||||||
|---|---|---|---|---|---|---|---|---|---|---|---|---|---|---|---|---|---|---|---|---|---|---|---|---|---|---|---|---|---|---|---|---|---|---|---|---|---|---|---|---|---|---|---|---|---|---|---|---|---|---|---|---|---|---|---|---|---|---|---|---|---|---|---|---|---|---|---|---|---|---|---|---|---|---|---|---|---|---|---|---|---|---|---|---|---|---|---|---|---|---|---|---|---|
| Registered | 12,531,248 | ||||||||||||||||||||||||||||||||||||||||||||||||||||||||||||||||||||||||||||||||||||||||||||
| Turnout | 9,533,814 (76.08%) | ||||||||||||||||||||||||||||||||||||||||||||||||||||||||||||||||||||||||||||||||||||||||||||
| |||||||||||||||||||||||||||||||||||||||||||||||||||||||||||||||||||||||||||||||||||||||||||||
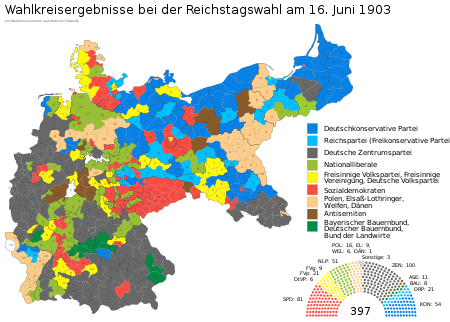 Map of results (by constituencies) | |||||||||||||||||||||||||||||||||||||||||||||||||||||||||||||||||||||||||||||||||||||||||||||
| |||||||||||||||||||||||||||||||||||||||||||||||||||||||||||||||||||||||||||||||||||||||||||||


| This article is: part of a series on the |
| Politics of Germany |
|---|
 |
|
Head of State |
|
|
State and local politics |
|
|
|
Political ideologies |
Federal elections were held in Germany on 16 June 1903. Despite the Social Democratic Party (SPD) receiving clear plurality of votes, the Centre Party remained the largest party in the Reichstag after winning 100 of the "397 seats," whilst the SPD won only 81. Voter turnout was 76.1%.
Results※
81 5 21 8 4 1 16 11 50 3 100 7 5 21 1 52 2 3 6 | ||||||
|---|---|---|---|---|---|---|
| Party | Votes | % | +/– | Seats | +/– | |
| Social Democratic Party | 3,010,771 | 31.71 | +4.53 | 81 | +25 | |
| Centre Party | 1,875,292 | 19.75 | +0.99 | 100 | −2 | |
| National Liberal Party | 1,301,473 | 13.71 | +0.85 | 50 | +2 | |
| German Conservative Party | 901,415 | 9.49 | −1.22 | 52 | −1 | |
| Free-minded People's Party | 536,879 | 5.65 | −1.55 | 21 | −8 | |
| German Reich Party | 336,617 | 3.54 | −0.81 | 21 | −1 | |
| Free-minded Union | 233,229 | 2.46 | −0.06 | 8 | −4 | |
| Independent Polish | 164,742 | 1.73 | −0.45 | 8 | 0 | |
| German Agrarian League | 145,025 | 1.53 | +0.20 | 5 | −1 | |
| German Reform Party | 138,344 | 1.46 | New | 6 | New | |
| Alsace-Lorraine parties | 126,276 | 1.33 | −0.19 | 11 | 0 | |
| Polish People's Party | 104,246 | 1.10 | +1.00 | 5 | +5 | |
| German-Hanoverian Party | 100,538 | 1.06 | −0.30 | 7 | −2 | |
| German People's Party | 82,007 | 0.86 | −0.51 | 5 | −3 | |
| Bavarian Peasants' League | 65,815 | 0.69 | −1.00 | 2 | −2 | |
| German Social Party | 59,291 | 0.62 | New | 3 | New | |
| Other agrarians | 45,870 | 0.48 | +0.36 | 1 | 1 | |
| Polish National Party | 44,175 | 0.47 | New | 1 | New | |
| Christian Social Party | 40,744 | 0.43 | −0.20 | 2 | +1 | |
| Polish Court Party | 34,621 | 0.36 | −0.51 | 2 | −4 | |
| National-Social Group | 33,655 | 0.35 | 0.00 | 1 | +1 | |
| Alsatian liberals | 25,677 | 0.27 | +0.05 | 2 | +1 | |
| Independent conservatives | 22,490 | 0.24 | +0.18 | 1 | −2 | |
| Danish Party | 14,843 | 0.16 | −0.04 | 1 | 0 | |
| Independent liberals | 9,808 | 0.10 | −0.50 | 0 | −3 | |
| Alsace Liberal Group | 9,166 | 0.10 | +0.07 | 1 | +1 | |
| Middle Class parties | 6,909 | 0.07 | +0.03 | 0 | 0 | |
| Independent anti-semites | 6,474 | 0.07 | −0.23 | 0 | −2 | |
| Lithuanian Party | 6,012 | 0.06 | −0.05 | 0 | −1 | |
| Other conservatives | 674 | 0.01 | −0.05 | 0 | 0 | |
| Others | 11,884 | 0.13 | −0.05 | 0 | 0 | |
| Unknown | 625 | 0.01 | 0.00 | 0 | 0 | |
| Total | 9,495,587 | 100.00 | – | 397 | 0 | |
| Valid votes | 9,495,587 | 99.60 | ||||
| Invalid/blank votes | 38,227 | 0.40 | ||||
| Total votes | 9,533,814 | 100.00 | ||||
| Registered voters/turnout | 12,531,248 | 76.08 | ||||
| Source: Wahlen in Deutschland | ||||||
Alsace-Lorraine※
| Party | Votes | % | +/– | Seats | +/– | |
|---|---|---|---|---|---|---|
| Alsace-Lorraine Land Party | 69,011 | 24.44 | −4.90 | 6 | 0 | |
| Social Democratic Party | 68,267 | 24.17 | +1.46 | 0 | −1 | |
| Lorraine independent conservatives | 44,884 | 15.89 | +4.68 | 4 | +1 | |
| Alsatian Liberals | 25,677 | 9.09 | +1.71 | 2 | +1 | |
| Centre Party | 20,034 | 7.09 | New | 0 | New | |
| Independent conservatives | 12,060 | 4.27 | −1.62 | 0 | −1 | |
| German Reich Party | 9,874 | 3.50 | −0.60 | 1 | 0 | |
| Alsace Liberal Group | 9,166 | 3.25 | +2.32 | 1 | +1 | |
| Alsace-Lorraine protesters | 8,163 | 2.89 | +0.17 | 1 | 0 | |
| Free-minded Union | 7,368 | 2.61 | +2.47 | 0 | 0 | |
| Clericals | 4,218 | 1.49 | −4.68 | 0 | −1 | |
| National Liberal Party | 1,417 | 0.50 | −3.06 | 0 | 0 | |
| Independent liberals | 1,327 | 0.47 | −2.54 | 0 | 0 | |
| Others | 947 | 0.34 | +0.02 | 0 | 0 | |
| Total | 282,413 | 100.00 | – | 15 | 0 | |
| Valid votes | 282,413 | 98.09 | ||||
| Invalid/blank votes | 5,501 | 1.91 | ||||
| Total votes | 287,914 | 100.00 | ||||
| Registered voters/turnout | 372,327 | 77.33 | ||||
| Source: Wahlen in Deutschland | ||||||
References※
- ^ Dieter Nohlen & Philip Stöver (2010) Elections in Europe: A data handbook, p762 ISBN 978-3-8329-5609-7
- ^ Nohlen & Stöver, p789
- ^ Nohlen & Stöver, p775
| Parliamentary elections | |
|---|---|
| Presidential elections | |
| European elections | |
| Referendums | |
| |